
This is just a follow up post to my post from yesterday (see here). Here, I look at the best and worst times to publish by most popular tag. So, I took the top 10 main tags by popularity over the period and created a graph for each.
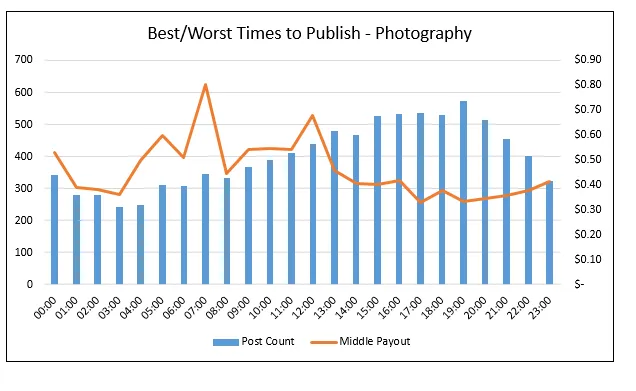
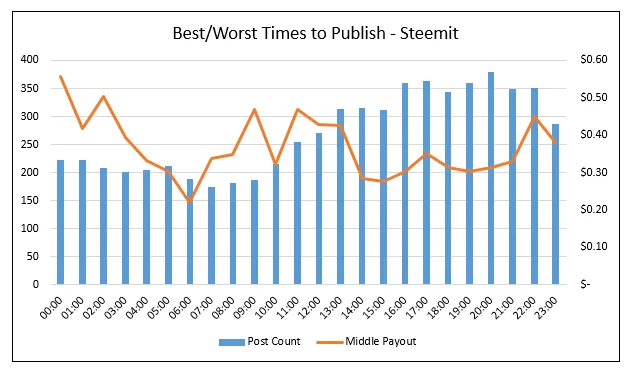
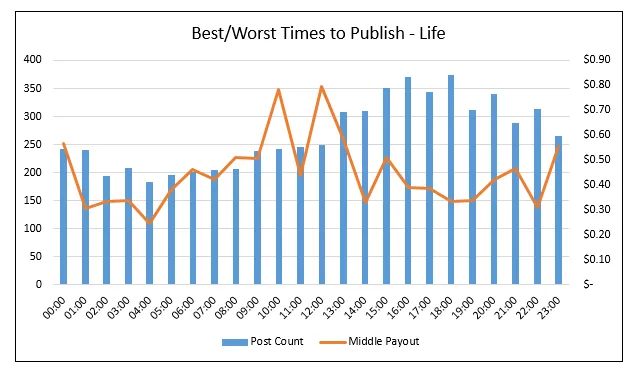
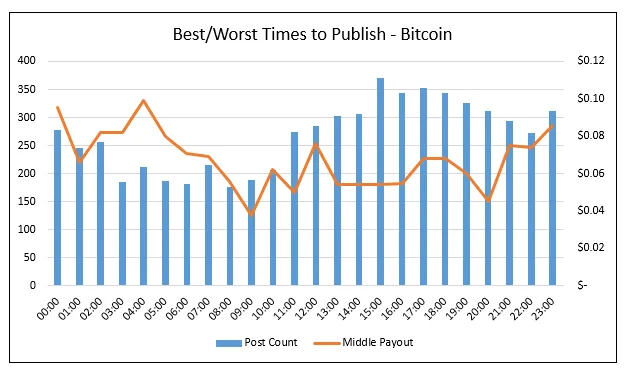
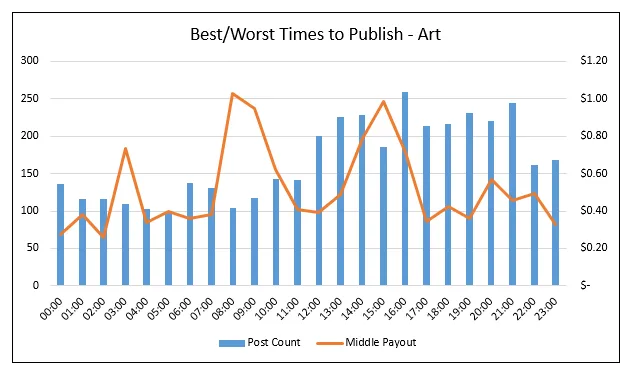
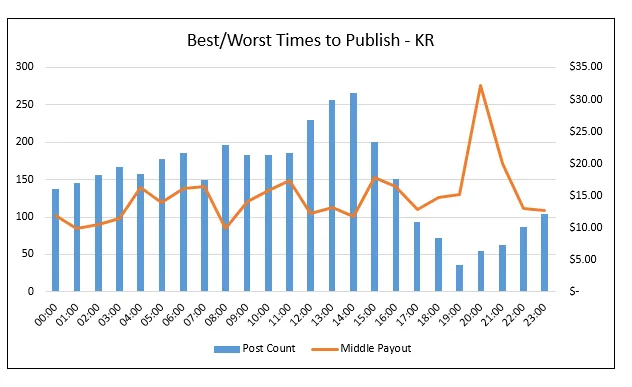
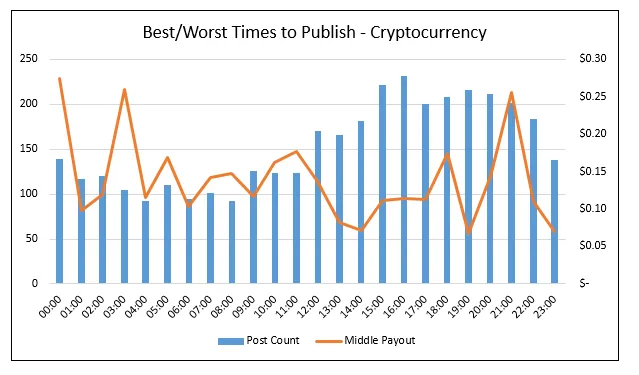
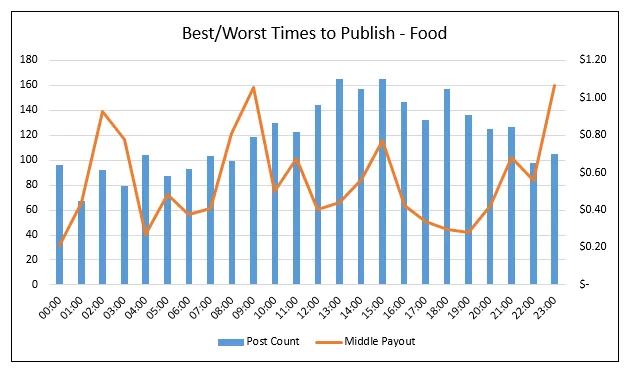
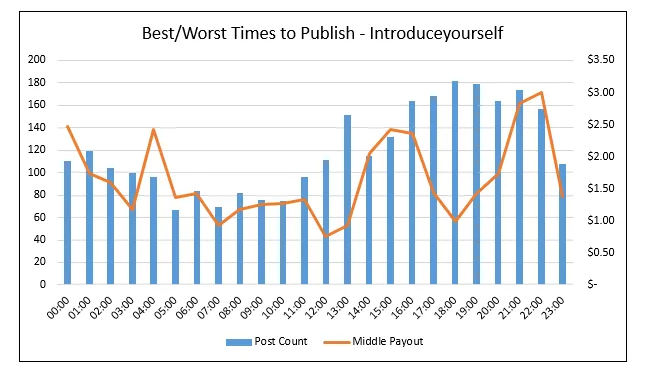
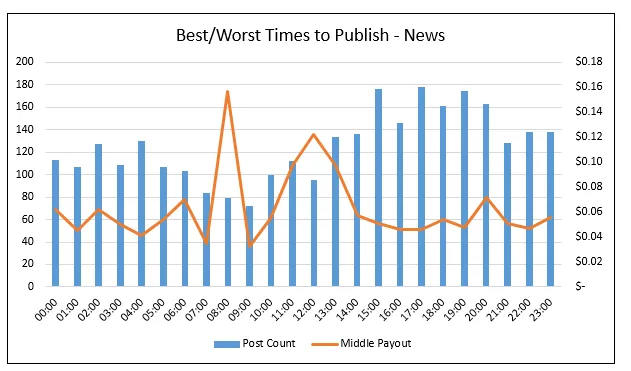
The 10 graphs below each show the total posts published each hour (UTC time) as well as the middle payout from the total range of payouts.
For this analysis I have taken a longer period of time - 01/06/2017 to 16/06/2017
You will see the shape of the graph is quite different for "KR" as this tag is for Korea and we would expect the busy times to vary.
Here are the results.
photography
steemit
life
bitcoin
art
kr
cryptocurrency
food
introduceyourself
news
Thank you for reading.