Karl Pearson was born on March 27, 1857, in London, England. His interest in statistics arose as he proceeded to develop mathematical methods to study the processes of heredity and Darwin's theory of evolution.
Between 1893 and 1912, Pearson wrote his most valuable work: a set of 18 articles entitled Mathematical Contributions to the Theory of Evolution, which contain contributions to regression analysis, the correlation coefficient, and includes the chi-square test of statistical significance. Also, Pearson was responsible for the creation of the term "standard deviation" and the maximum likelihood distribution function.
The concept of correlation coefficient was developed by Pearson along with Galton, but they did not determine a formal definition (STANTON, 2001). Thus, according to Moore (2007), we can define the correlation coefficient as "the correlation that measures the direction and degree of the linear relationship between two quantitative variables".
The correlation coefficient can be summarised in a single sentence "Pearson's correlation coefficient (r) is a measure of linear association between variables". The concept of association is related to the similarity that two variables hold in the distribution of their data, and linearity is related to the assumption that the growth and/or decay of a unit of the (independent) variable X generates the same Impact on the variable Y (dependent). Thus, Pearson's correlation coefficient requires that there be a sharing of variances and that such variations are linearly distributed.
The correlation coefficient is given, according to Pearson and Galton, by the following formula:
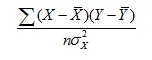
where X and Y represent the sample data;  and
and  are the means of the variables X and Y, respectively; n number of sample elements; and
  the variance of X.
Currently, after a simplification in the above formula, we can determine the correlation coefficient using the formula:
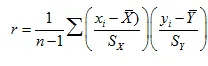
where  and
and  represent the sample data;
  and
and  are the means of the variables X and Y, respectively; n number of sample elements;
  and
and  the sample standard deviations of X and Y, respectively.
Pearson's correlation coefficient variation occurs in the interval [-1, 1], its signal indicates the direction (positive or negative) of the relationship between the variables and its value suggests the strength of the relationship between the variables.
In general, we can standardise the interpretation of the correlation coefficient as follows: the closer to 1 the value is, the greater the degree of dependence between the variables, the closer to zero, the less this dependence.
Pearson's correlation coefficients have some propriety:
- Pearson's correlation coefficient does not differentiate between independent variables and dependent variables. Thus the coefficient is the same for both X about Y, and Y about X.
- The value of the correlation does not change when changing the unit of measurement of the variables.
- The coefficient has a dimensionless character, that is, it is devoid of physical unity that defines it.
Also, some conditions must be satisfied to calculate the correlation coefficient:
a) Correlation requires that the variables be quantitative (continuous or discrete).
b) The observed values must be normally distributed.
c) It is necessary to analyse outliers since the correlation coefficient is strongly affected by their presence.
d) Independence of observations is necessary, that is, the occurrence of one observation does not influence the occurrence of another observation.
According to Osborne and Waters (2002), violation of these conditions may cause the researcher to make type I errors (reject a hypothesis of true experimentation), and type II (not reject a hypothesis of false experimentation), and these are factors that the researcher want to minimise in their experiments.
REFERENCE
STANTON, J. M. Galton, Pearson, and the peas: A brief history of linear regression for statistics instructors. Journal of Statistical Education, v. 9, n. 3, 2001.
MOORE, D. S. The Basic Practice of Statistics. New York, Freeman, 2007.
OSBORNE, J., WATERS, E. Four assumptions of multiple regression that researchers should always test. Practical Assessment, Research & Evaluation, v. 8, n. 2, 2002.