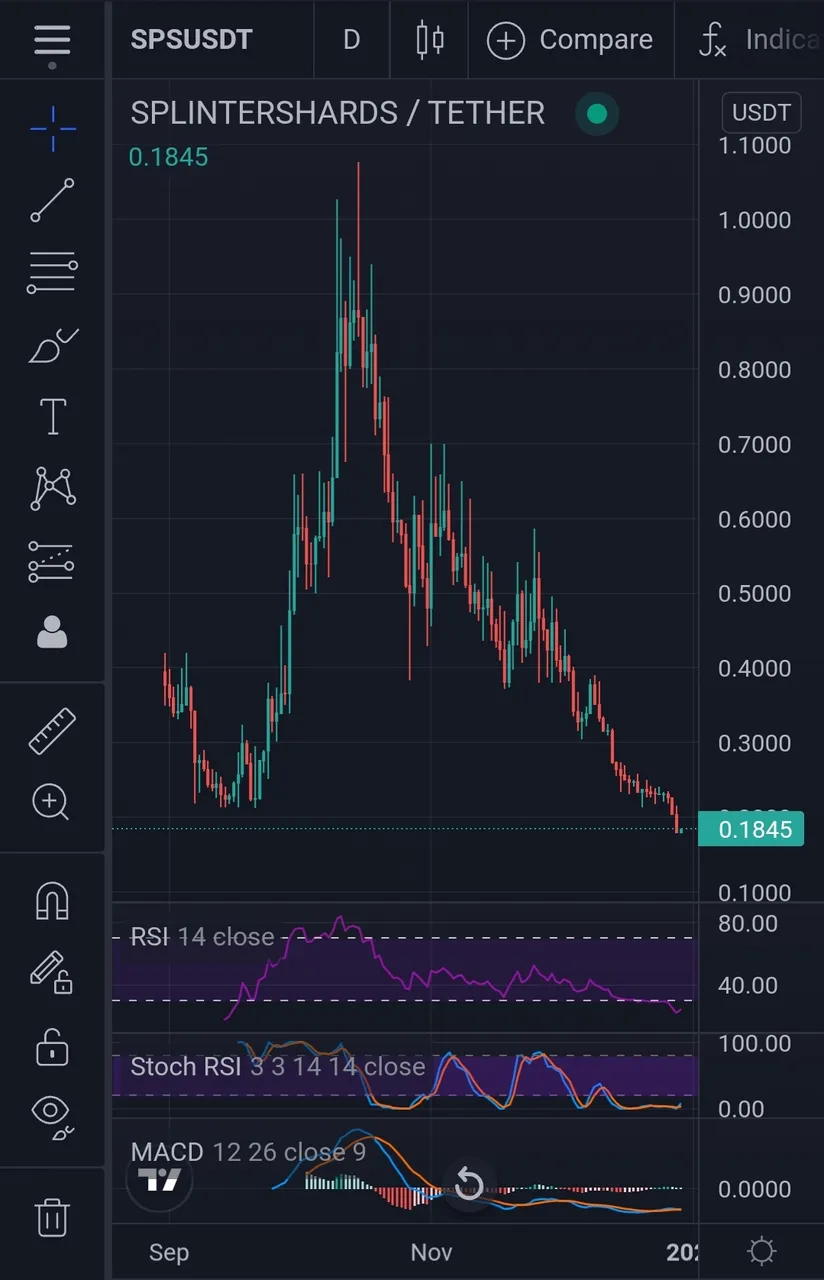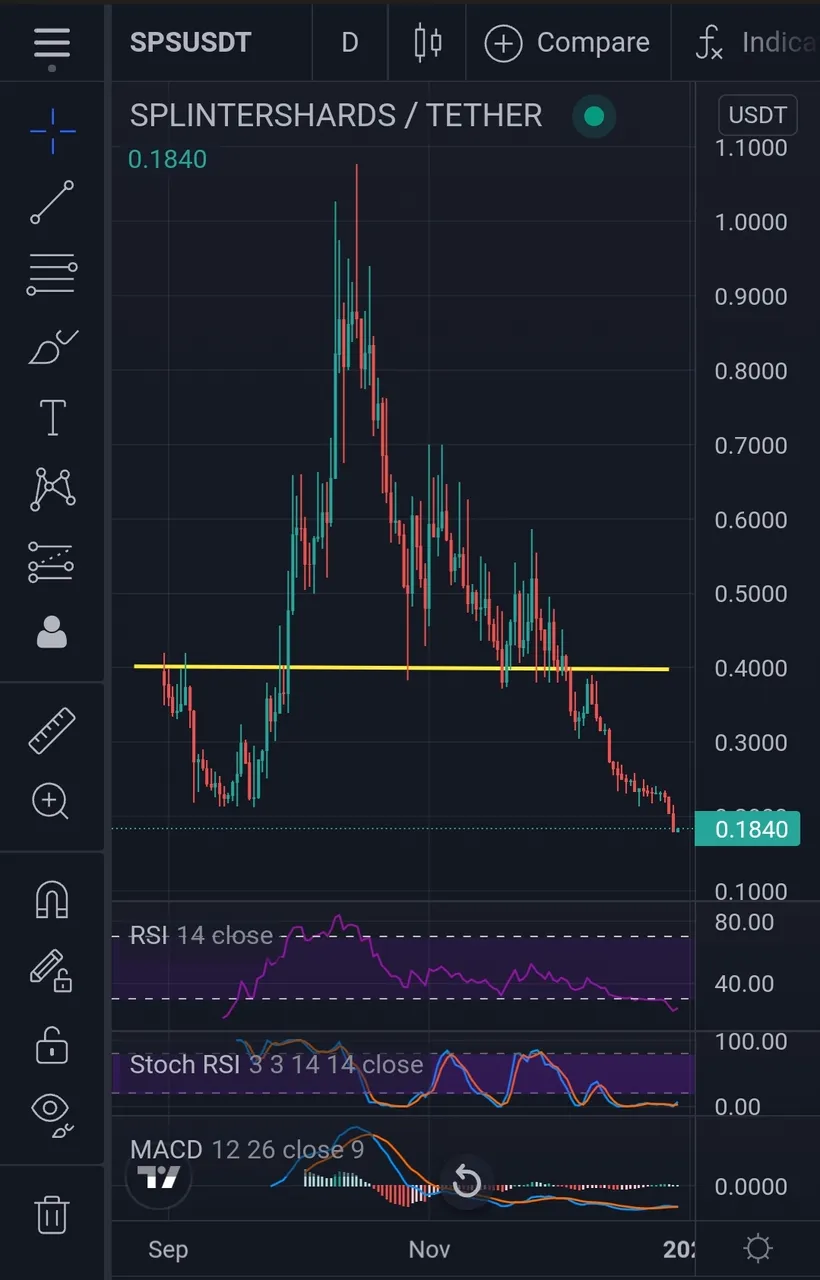
Its nice to see that tradingview is now showing Coinex charts, so SPS is now available to look at. I dont pay for tradingview, just logged in for free version, but i do like the way i have it setup, with a few indicators. Just interesting to see how many supports have broken actually. Since the big rally above .90 cents, its been a series of lower lows.

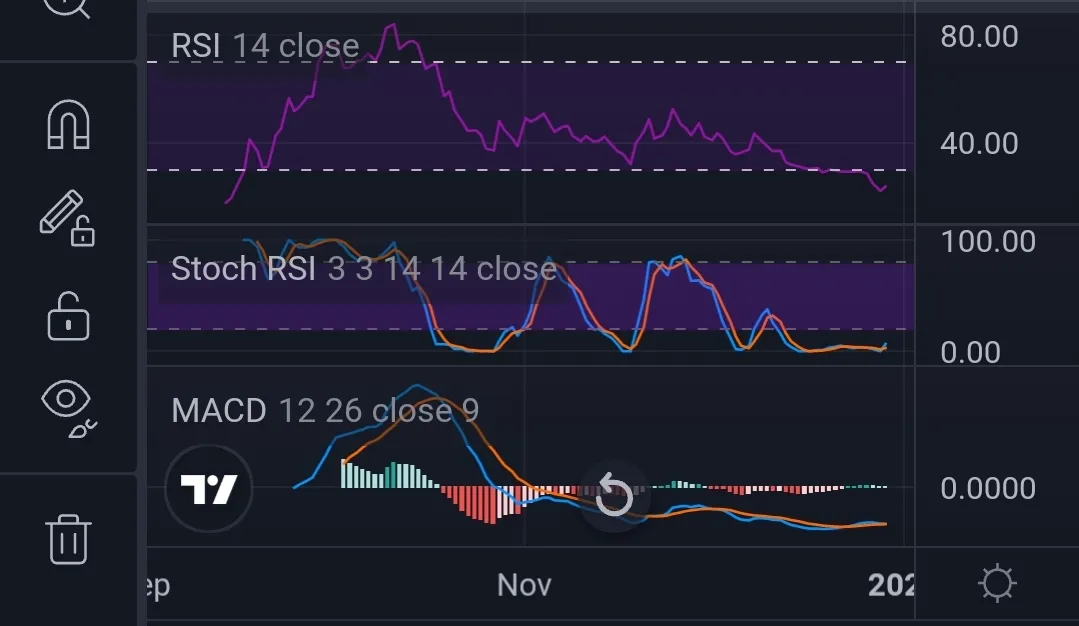
RSI, Stoch RSI, and MACD are all on the floor, showing a lot of selling, and downward momentum.

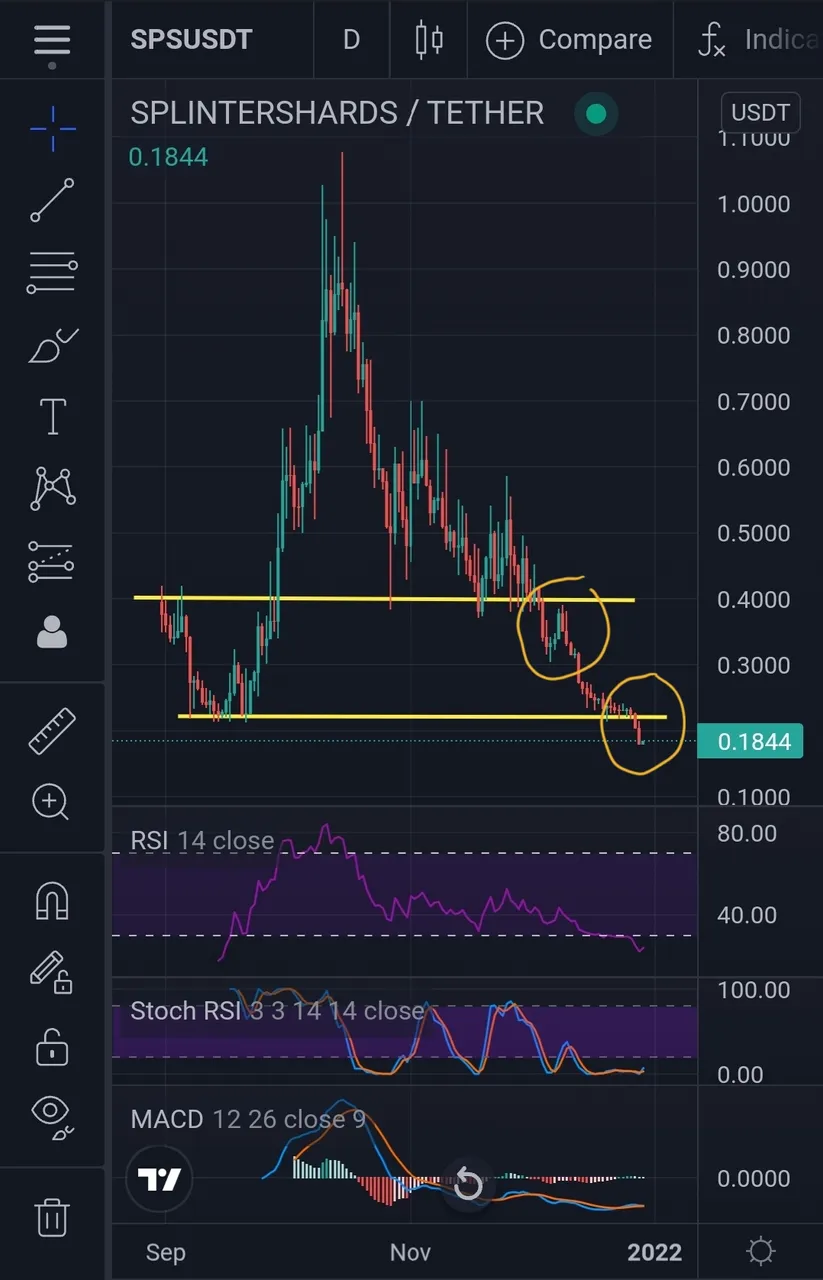
.40 cents was trying to hold up (yellow line), but failed after spending some time bouncing there.

After breaking down below .40 cents, it did drop to roughly .30, and tried making a move back up (1st circle). After getting rejected, weve been going down further, consolidating near .20 cents, and broken below to what may be new all time lows.
Time will tell if this was all due, and is part of the plan. Maybe we go sideways for a while. If splinterlands continues to have some success, than maybe SPS will find some stability.