The Solana chain has gone through a roller coaster ride. It has been one of the main stars of the bull run from 2021, reaching the top 5 in token valuation and close to 100 billons market cap. Then it went through a massive depression phase with the price going down more than 95%, and in the last year it has emerged strong again. The market cap and the price of the token have increased as well.
Let’s see how the network activities are doing under the current market conditions.
Solana has some unique tech. It is a sort of hybrid between Proof of Stake (PoS) and a novel concept that they call Proof of History. There is a lot to say about the proof of history concept, but in short here we will just mention that it is a concept that checks all the transactions in the right order/sequence. The Solana blockchain works with slots for periods of time, in which the chosen validators confirm the transactions.
Solana has a reputation for being one of the fastest blockchains, with a theoretical possible 65k transactions per second. Solana also has a controversial reputation over its decentralization since it has been put under maintenance and stopped operating a few times in the past.
We will be looking at:
- Total Value Locked TVL
- Active addresses
- Daily transactions
- Fees
- Staking and voting Rewards
- Inflation and supply
- Market cap
The period that we are looking into is 2021 to 2024.
The data for the analysis are taken from Defi Lama and Dune Analytics.
Total Value Locked
This is one of the most used metric for chains and apps representing the mount of value that is stored and handled by the chain. At the moment the chart for Solana looks like this.
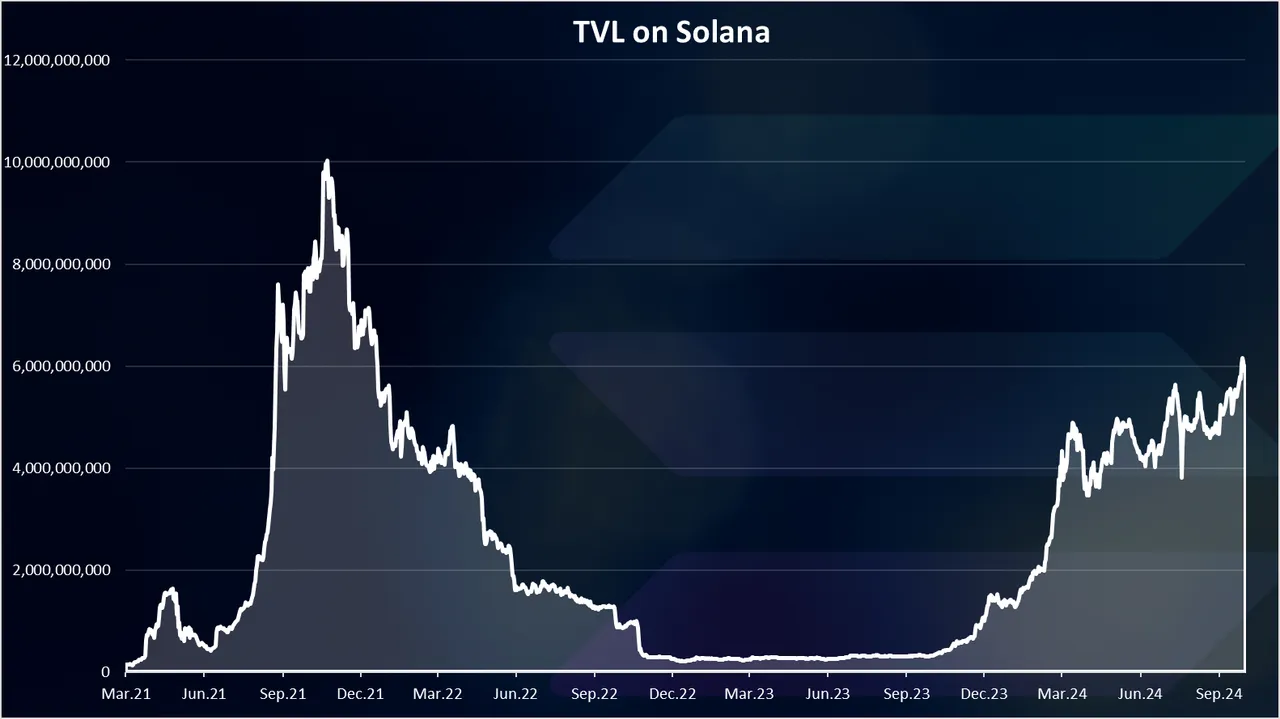
Quite the ride.
Going from zero to 10B in the previous bull run, a drop to 300M in 2023. A growth again starting from the end of 2023, and we are now at 6B in TVL on Solana. Still lower then the previous heights.
Active Addresses
One of the key metrics for a blockchain is the number of active wallets. Here is the chart.
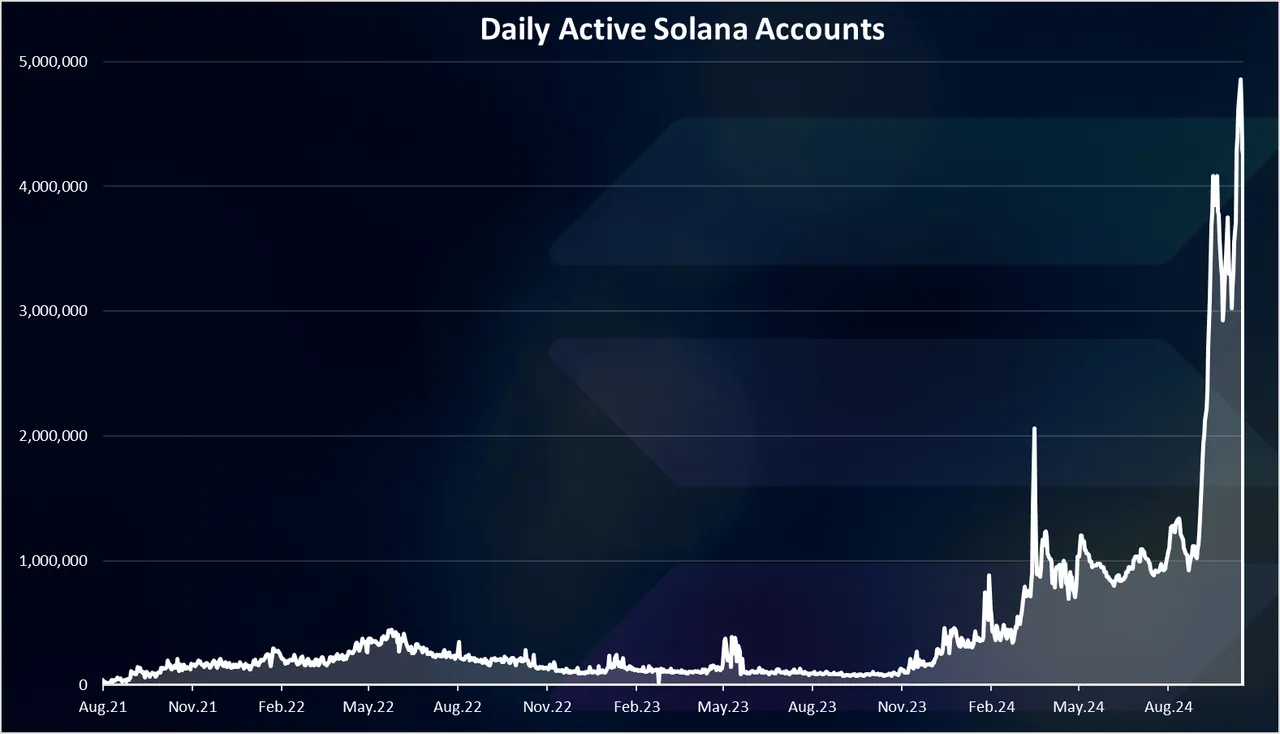
A massive spike at the end of this chart with a new ATH for the number of daily active wallets. Close to 5M DAUs on the Solana chain now far outpacing the previous numbers in 2021 when there was around 500k DAUs at the top.
For comparison the number of active wallets on ETH is somewhere around 500k, so the 5M on Solana are quite a lot. Still not sure how many of these are unique users and how many bots, my guess is that there is a lot of bots, but still the activity is high.
On a monthly basis the chart for active wallets looks like this:
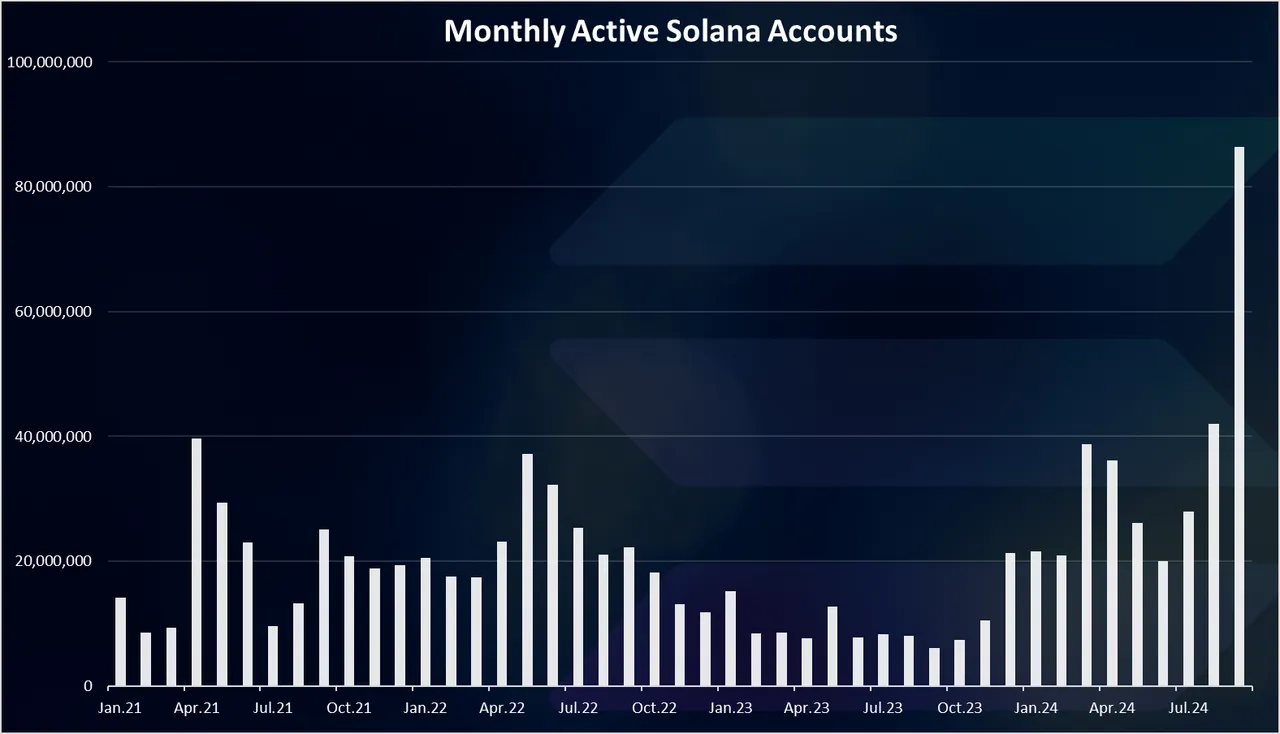
Here again we can notice the spike in the last month with an amazing 80M MAUs in September 2024! Again not sure how many of these are bots.
Daily Transactions
The activity on the networks is mostly represented by the number of daily transactions. Here is the chart.
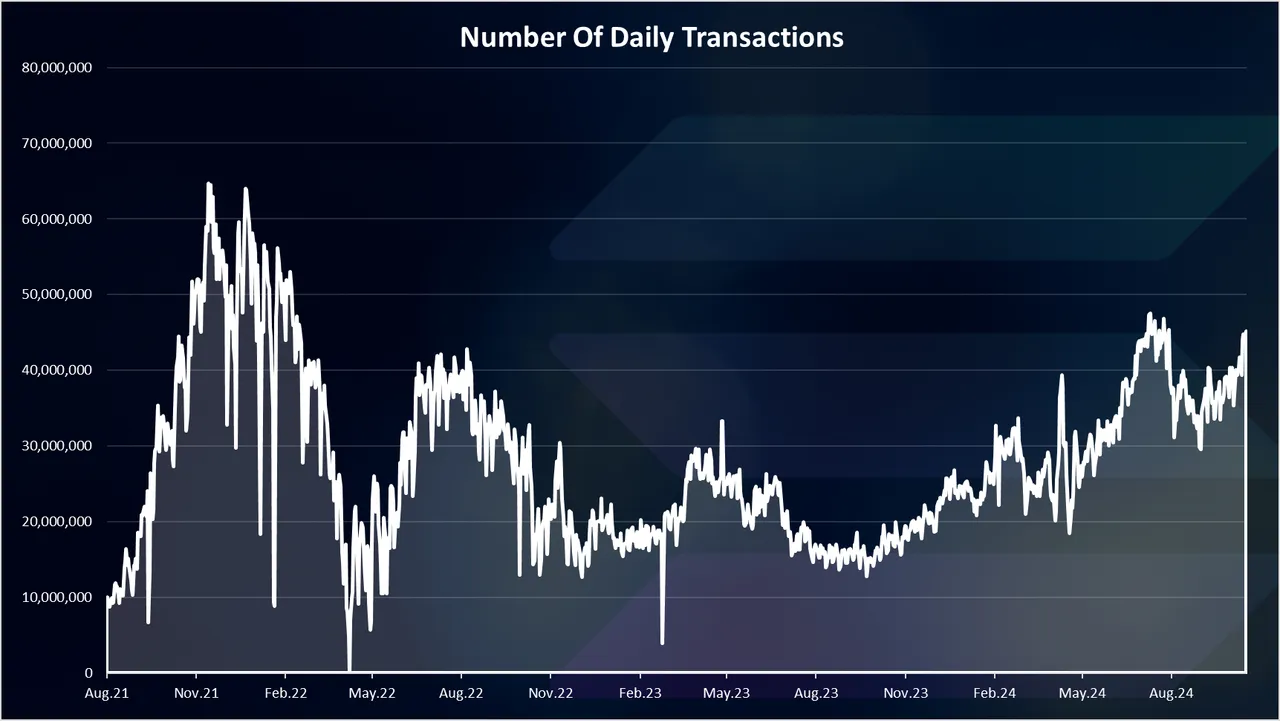
The number of transactions is where Solana shines. It probably holds the record for a number of daily active transactions.
At the peak there were more than 60M transactions per day. In the last period there are 40M transactions per day and have increased from around 20M.
Compared to ETH where there is just above 1M, or even Polygon where there is 5M to 10M transactions per day, Solana is leading by a lot.
Fees
Fees are quite the unpopular topic and one of the main reasons for the new EVM chains, as users are trying to find a way to escape ETH high fees.
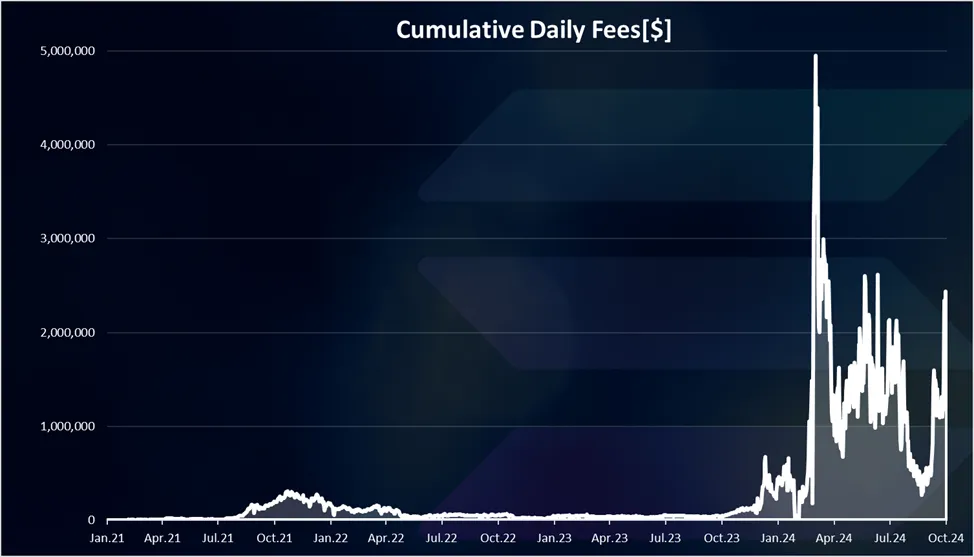
Cumulative fees per day in USD.
A massive spike in the beginning of 2024 with daily cumulative fees reaching 5M at one point. A drop since then and we are now around 2M USD in fees daily on Solana.
On average per transaction in the past the fees are under one cent, occasionally reaching a cent.
Solana is one of the cheapest blockchain to transact on. Because of the very cheap fees we have seen a lot of botting on the chain, but it still manages the traffic. The thing is the validators need a lot of resources to maintain the speed and the numbers of transactions. Half of the fees are burned and half goes to validators.
Staking and Voting Rewards
Fees are just one aspect that the Solana validator receives as rewards. There are also staking rewards and voting rewards.
Here are the charts.
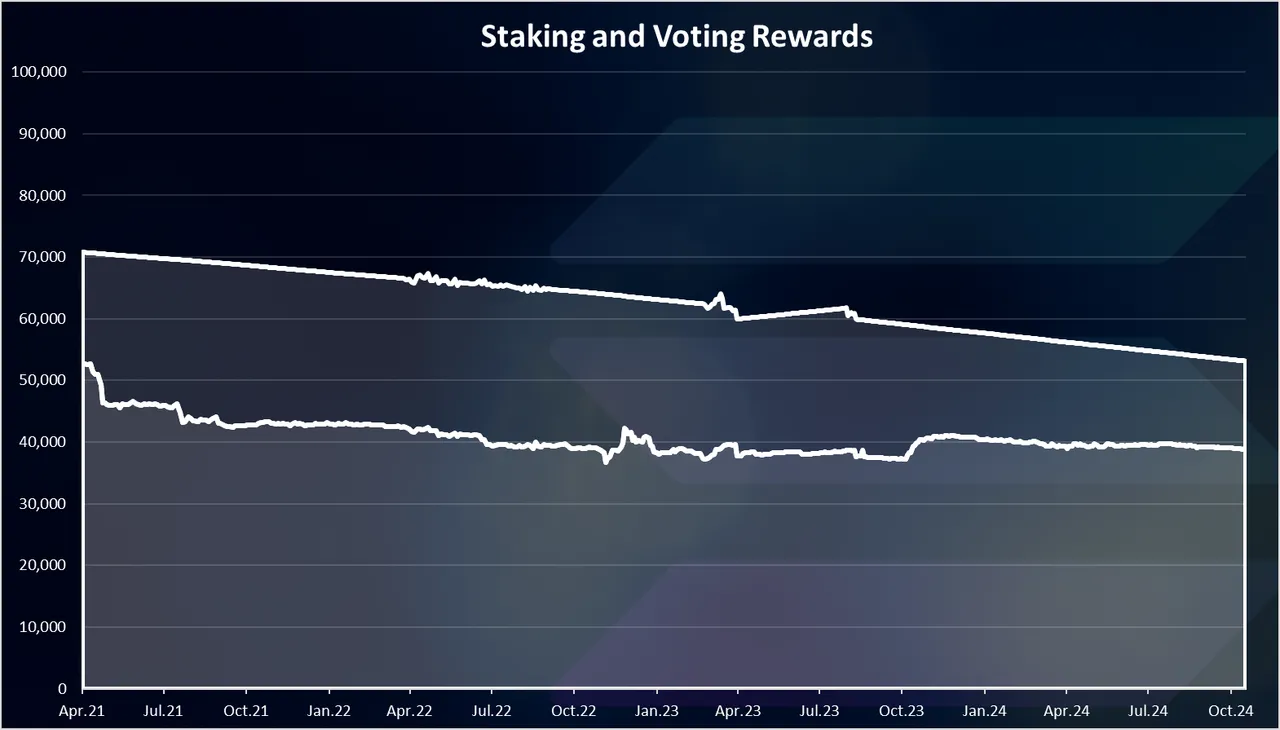
The staking rewards are at the bottom of the chart, while the voting on the top. Cumulative these two types of rewards account for around 60k SOL daily.
The staking and voting rewards have been quite constant in the period, with a slow downtrend.
The daily SOL for staking rewards is around 40k, while the voting rewards are at 20k.
Inflation and Supply
Inflation and supply are on of the most important metrics for a blockchain. Here are the charts from the official Solana docs.
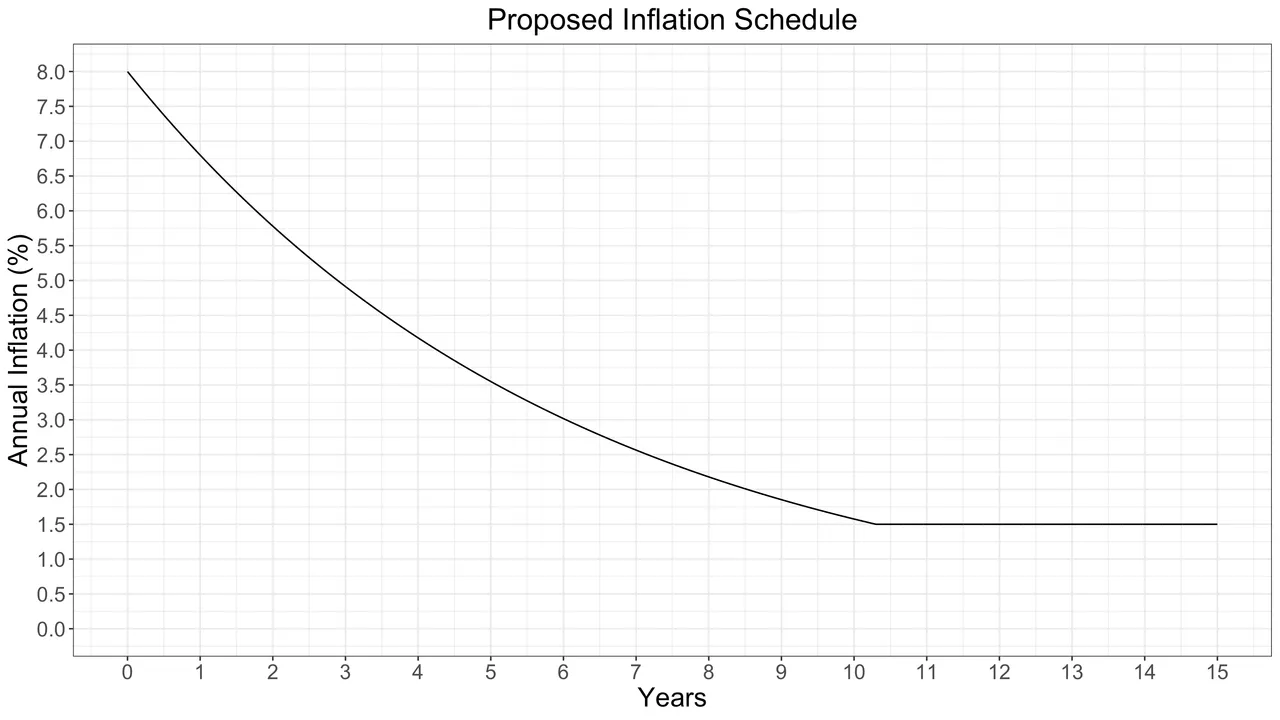
The inflation rate for Solana starts at 8% per year and drops each year, reaching 1.5% after 10 years and stays at that level for the future years.
The supply looks like this.
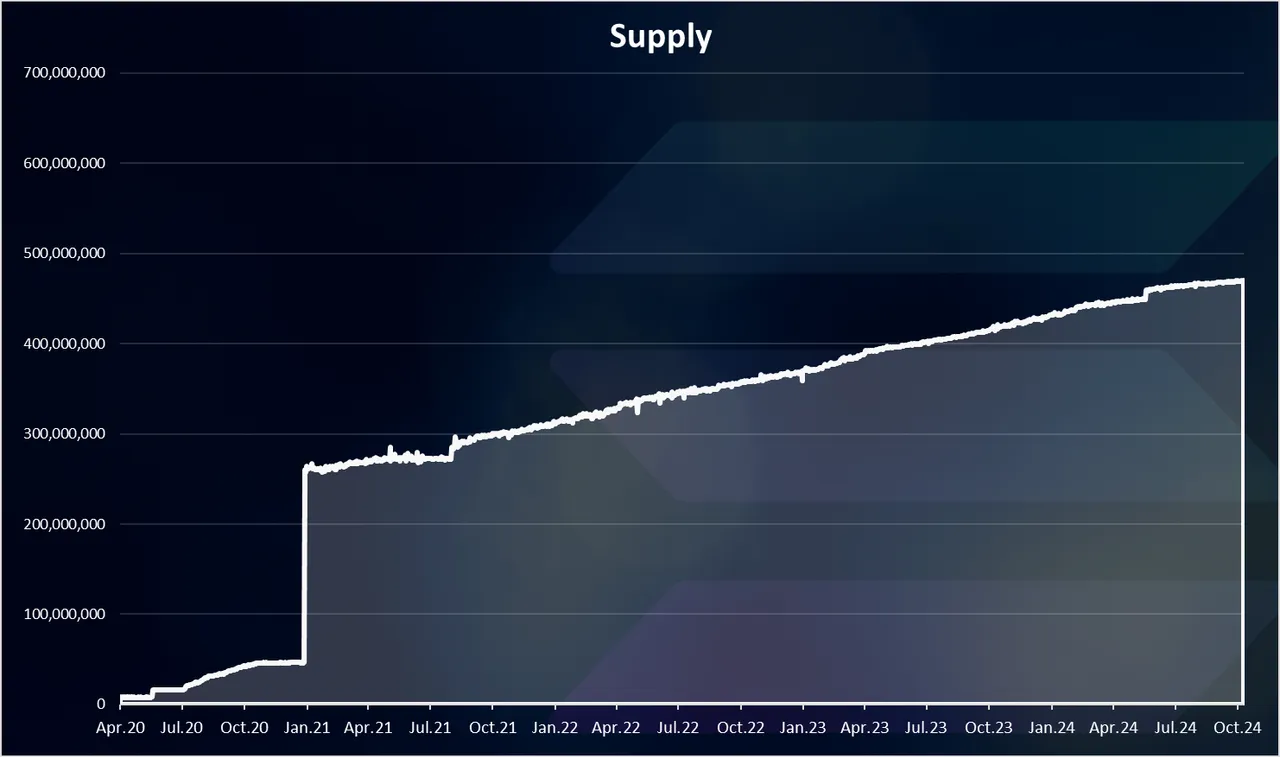
The current supply of Solana is close to 470M. From the inflation schedule it is projected to reach more than 700M in 10 years’ time. After that the inflation should slow down to 1.5% per year, and the supply should increase more slowly.
Market Cap
At the end the chart for the market cap.
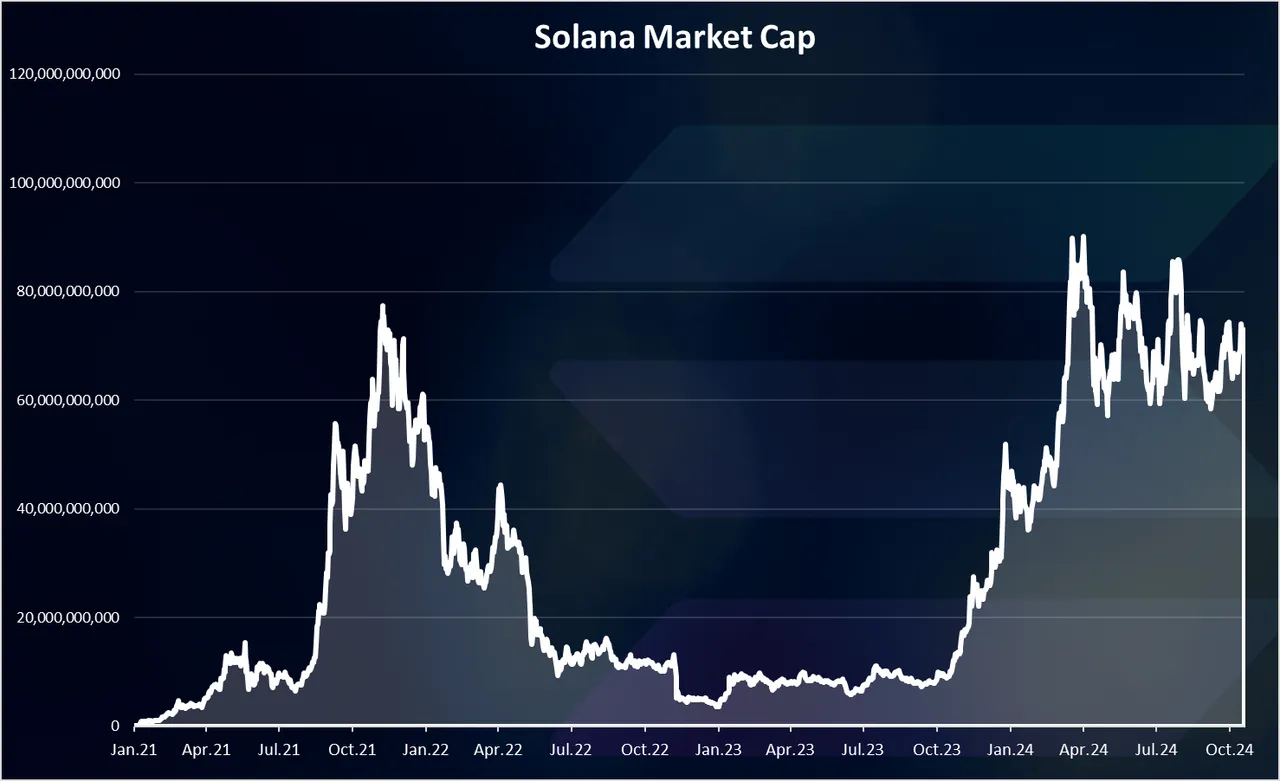
Solana has reached a new ATH in terms of market cap. While in terms of price it is still bellow prior to its past ATH. This is because there were new tokens added in the last years since 2021, more than 150M and this has pushed the market cap.
At the peak Solana reached an amazing 90B market cap, higher than the 2021 levels of 80B. At the moment the Solana market cap is around 70B. In terms of price it is now higher than 150 USD per token.
All the best
@dalz