The next little ice age Vol. 15
August 9-2017
Good morning, afternoon, night depending on where the reader is. We start with the sunspots as always. The 2670 sunspot is no longer geo-effective and keeps its magnetic field stable and does not pose a major threat to the Earth. In a few days the solar disk will be visible empty.
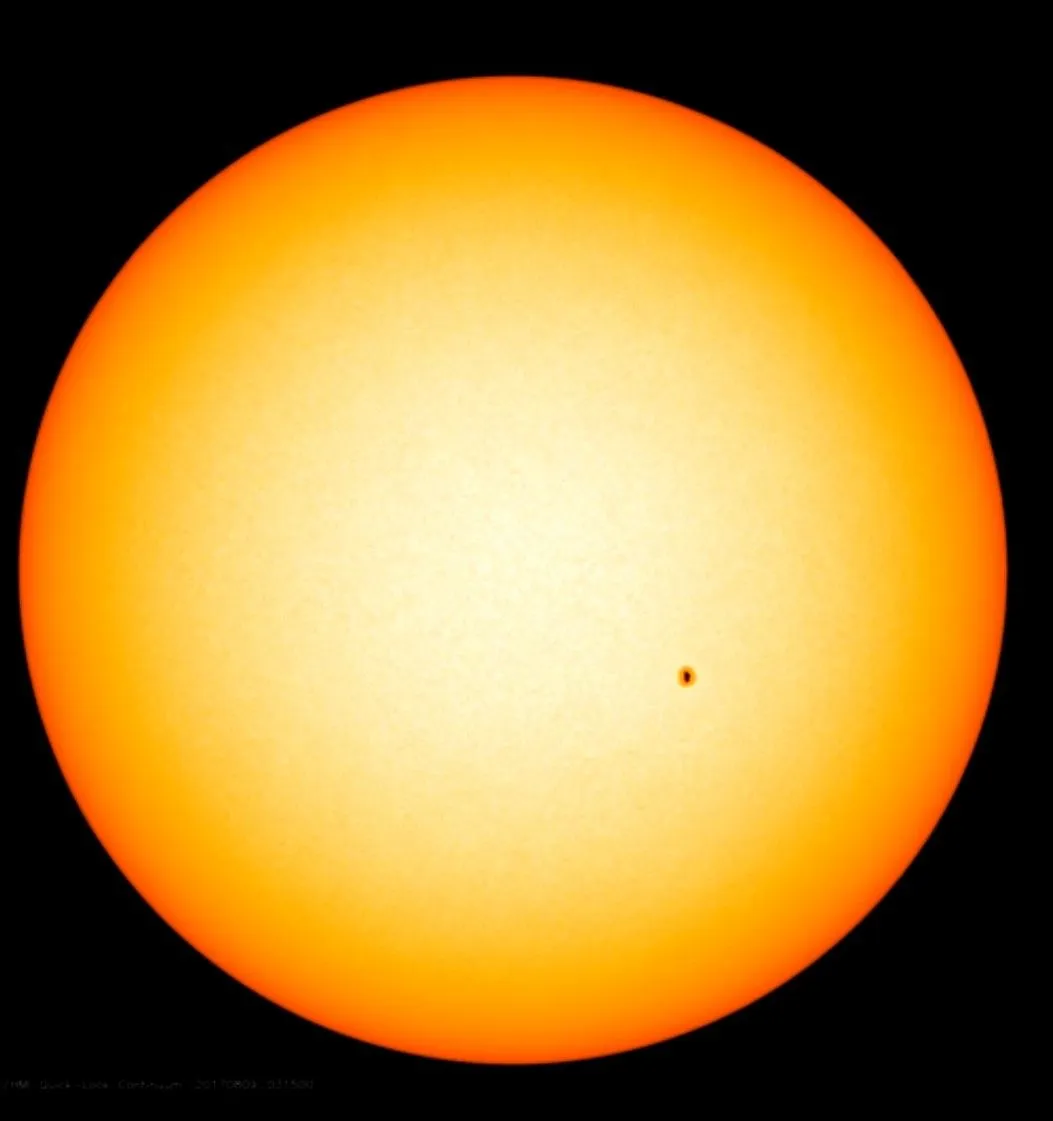
Source sdo nasa.
The huge coronal hole that has been sending fast solar wind to the earth leaves the visible solar disk and gives way to another coronal hole in the Equatorial zone of the sun. We will begin to notice the rapid solar wind coming from the coronal hole from August 11.
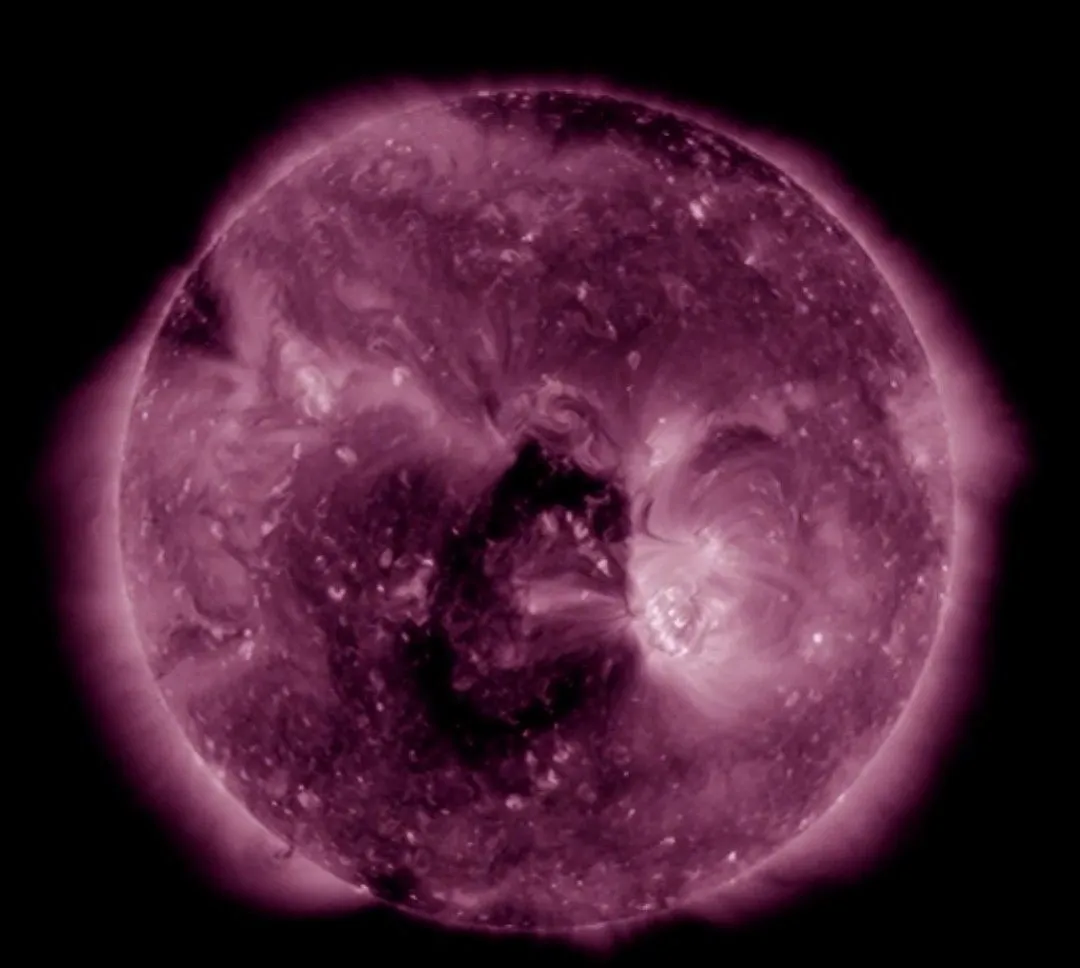
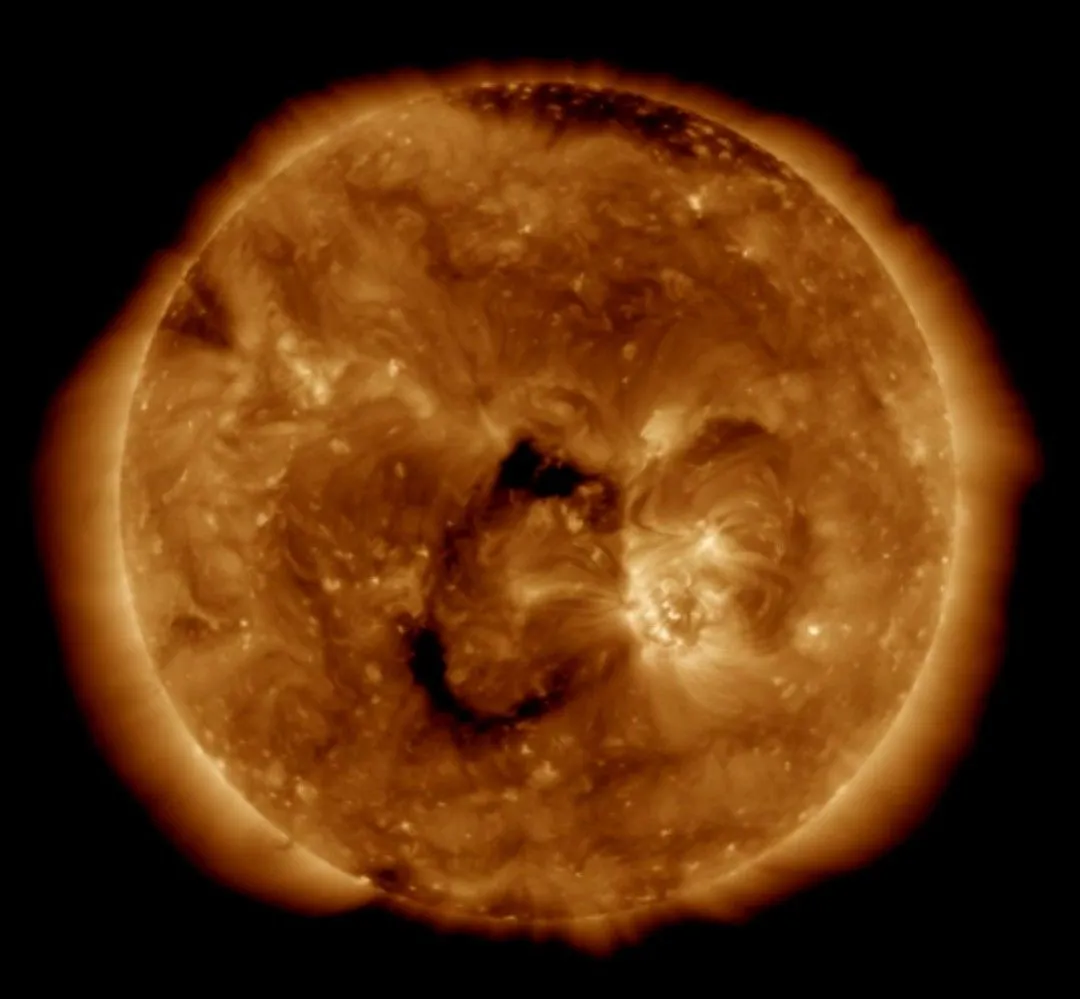
Source sdo nasa.
Summary :At this moment the Earth has already come out of the solar wind fast and the conditions are calm. The solar wind is at 410km / sec and the density of protons is at 7 protons per cubic centimeter.
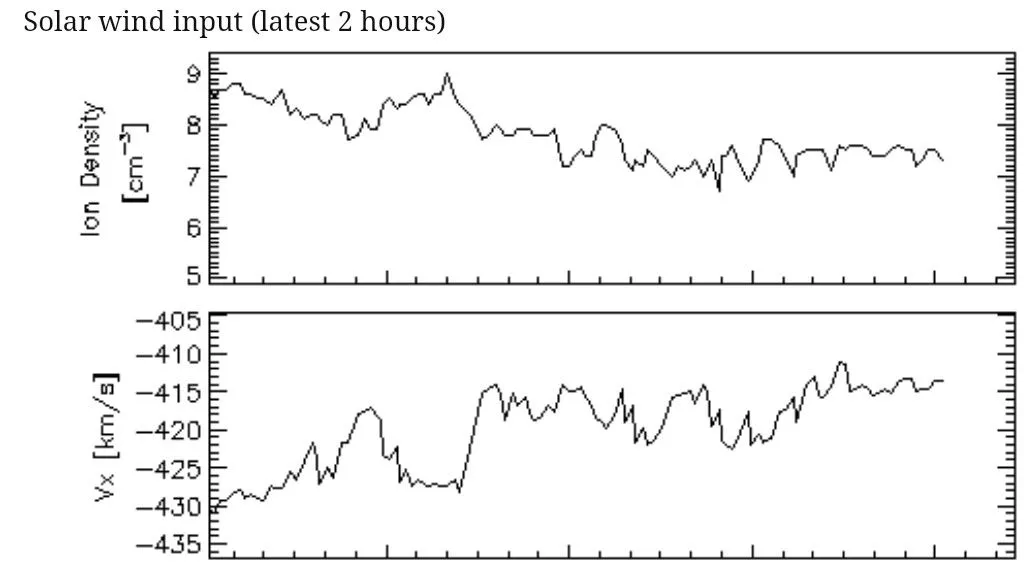
Source ccmc nasa.
In the chart at the bottom we can see how our magnetosphere behaves under these conditions.
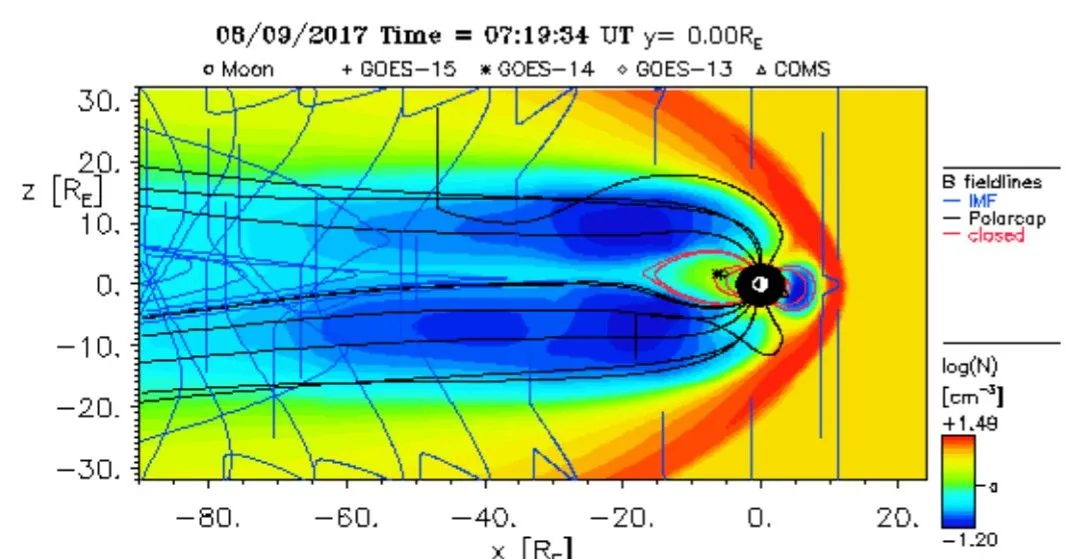
Source ccmc nasa.
-Small explanation of the reading of the graph:
In this graph the Sun is on the right the earth is the two-colored sphere (white and black) the dotted line is the orbit of the satellites that perform the readings. The solar wind arrives from the right pushing the lines of the magnetic field towards behind. If the lines are black the particles of the solar wind are pushed back and if they are red it is because the solar wind pushes them and collide. When they collide with each other, they close the circuit and discharge to the earth. They produce light phenomena in the upper layers of the atmosphere (auroras boreales)
*Today we must also highlight a 6.5 earthquake in China. At least eight people have died and 100 tourists are trapped in a popular tourist spot after the magnitude 6.5 quake in the Jiuzhaigou region.
-Conspiracy?
This is the summer they have had in Montreal.Since May 1st, Montreal's Trudeau Airport has recorded precipitation of a trace or more, on 65 of the last 100 days through August 8. On many of the other days, the weather has been overcast and cool.
And about USA
The different shades of blue and green highlight the regions where the colder temperatures than the seasonal ones have dominated, while the different shades of orange and red represent temperatures warmer than normal so far in August.
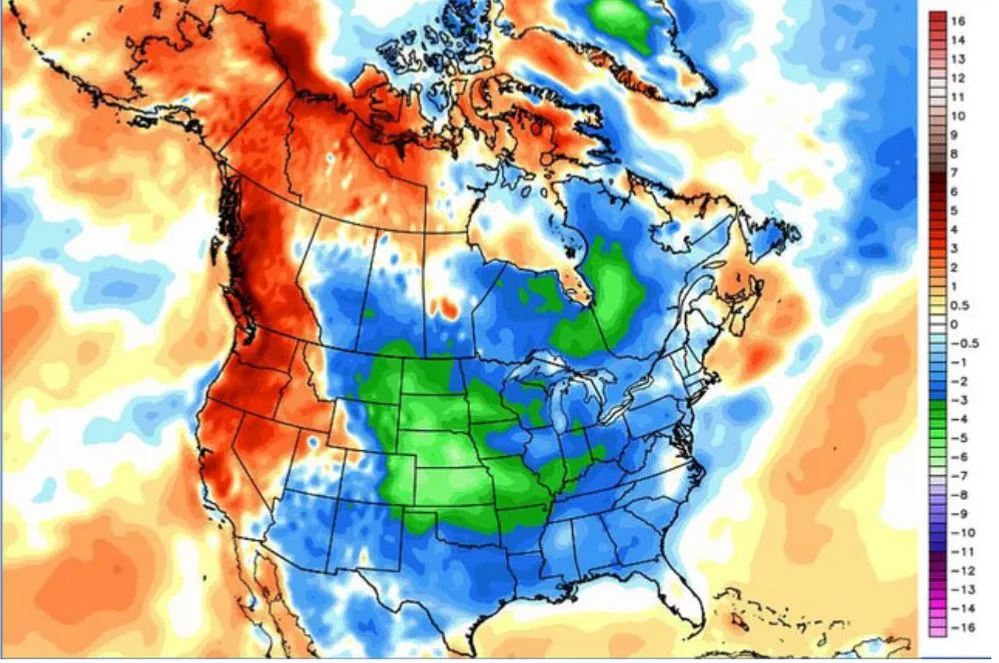
Source The Weather Network.
As we can clearly see in the temperature map all North America except the Pacific coast are with below average temperatures.
At this time of year if the forecast of the meteorological organisms that use the models of the global warming was being fulfilled the map of North America would be orange with the red strip of the United States of red color. It is a very simple explanation, I know, but it is the most visual way to explain it. Just look at the map to realize that the global warming model is not being met.
But…
What do you think?
All opinions are important to me.
If you found the post informative and you liked it please upvote! Feel free to restreem!
If you want to continue discovering more about our sun, follow me.You can also read my previous post.
*I advise you to read my previous posts in which I contributed data from recently published studies.
** I would like to make it clear that this series of articles is not intended to be a scientific document. It is a blog about the daily Solar activity and its possible effects for us humans. Since the Solar activity can have a great impact in different aspects of our life (changes in the climate, increase of the vulcanology and the seismicity, the UV radiation and damage the electrical systems and of telecommunications)
Thank you very much for the code to @playfulfoodie


Gift-thanks to @Son-of-Satire
