Check out the Sankey Diagram Generator I have just made. It supports self loops, moving around nodes in both horizontal and vertical directions and loading and saving diagrams! You can also change the opacity and the density of the links.
Use the Load/Save button to edit/create complex Sankey's.
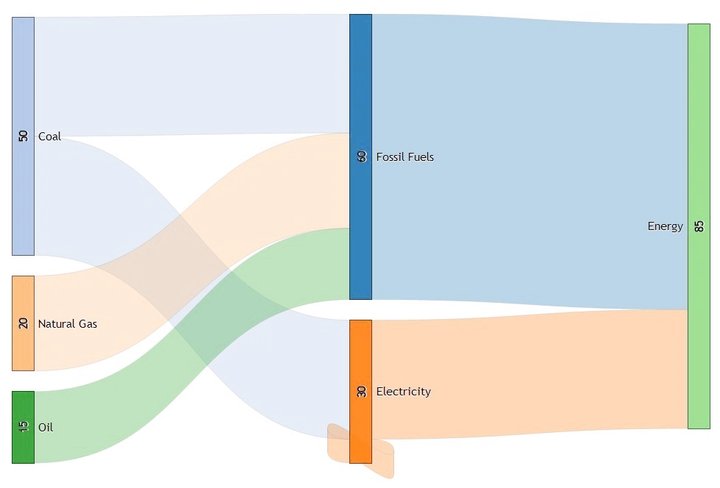
The source code for the Sankey displayed above is:
{"nodes":[{"name":"Oil"},{"name":"Natural Gas"},{"name":"Coal"},{"name":"Fossil Fuels"},{"name":"Electricity"},{"name":"Energy"}],"links":[{"source":0,"target":3,"value":15},{"source":1,"target":3,"value":20},{"source":2,"target":3,"value":25},{"source":2,"target":4,"value":25},{"source":3,"target":5,"value":60},{"source":4,"target":5,"value":25},{"source":4,"target":4,"value":5}]}
You can also use the keyword layer to create nodes fixed along the x-axis. In the above example, if you use "layer": 3 for the node Fossil Fuels and "layer":4 for Electricity, they will not be aligned, with the latter being placed to the right of the former.
{"nodes":[{"name":"Oil"},{"name":"Natural Gas"},{"name":"Coal"},{"name":"Fossil Fuels","layer":3},{"name":"Electricity","layer":4},{"name":"Energy"}],"links":[{"source":0,"target":3,"value":15},{"source":1,"target":3,"value":20},{"source":2,"target":3,"value":25},{"source":2,"target":4,"value":25},{"source":3,"target":5,"value":60},{"source":4,"target":5,"value":25},{"source":4,"target":4,"value":5}]}
You can also fix the size of a node using the keyword value.
{"nodes":[{"name":"Oil"},{"name":"Natural Gas"},{"name":"Coal"},{"name":"Fossil Fuels","layer":3,"value":10},{"name":"Electricity","layer":4},{"name":"Energy"}],"links":[{"source":0,"target":3,"value":15},{"source":1,"target":3,"value":20},{"source":2,"target":3,"value":25},{"source":2,"target":4,"value":25},{"source":3,"target":5,"value":60},{"source":4,"target":5,"value":25},{"source":4,"target":4,"value":5}]}
UDPATE: Using the keyword fill, you can also color the nodes (and automatically their links).
{"nodes":[{"name":"Oil"},{"name":"Natural Gas"},{"name":"Coal","fill":"black"},{"name":"Fossil Fuels","layer":3,"value":10},{"name":"Electricity","layer":4},{"name":"Energy"}],"links":[{"source":0,"target":3,"value":15},{"source":1,"target":3,"value":20},{"source":2,"target":3,"value":25},{"source":2,"target":4,"value":25},{"source":3,"target":5,"value":60},{"source":4,"target":5,"value":25},{"source":4,"target":4,"value":5}]}
UDPATE 2: Today the Sankey Diagram Generator got a major update: I have been working on the load and save functions to include the layout. Another minor update is that now you can toggle the node labels (both the text and values) on/off. On top giving you the option to save the Sankey structure and layout, now you can also save the diagram as a PNG image.
Now, when trying to save the Sankey code, a checkbox shows up next to the Done button, giving you the option to save the Sankey layout for loading later. This includes the node and link positions, as well as the settings for opacity and density. This is a major milestone as it has been a headache to redesign Sankeys, as previously only the structure was saved but not the layout. On the save screen now you also have the option to download the diagram as image.
As a result of these modifications, the Sankey save string changed a little bit in structure. In order to preserve background compatibility, the Sankey structure code - which made up the entirety of the save string up until now - was put under the key sankey, the parameters on whether to display labels, density and opacity under the key params and finally, the layout, if selected, under fixedlayout. Subsequently, when loading back the Sankey save string you are given the option to try to read the layout from the string. If you do not provide the layout, or you choose to ignore it (via a checkbox next to the Done button), the algorithm computes the layout for you automatically, as before. The structure of the fixedlayout key is a set of coordinates [x,y] for each of the nodes. So a fixedlayout string in the form of [[0,30],[0,20],[10,50]] will have 3 nodes, the first placed at x=0, y=30 on the screen, the second at 0, 20 and so on. These are pixel values starting in the top left corner.
UDPATE 3: Some users have requested to be able to create Sankeys with multiple flows between the same two nodes. This can be interpreted as having parallel links. While with a small number of parallel links, this is not a problem, the relaxation algorithm fails to lay out the links correctly in case of many. This algorithm is at the core of the rendering and therefore hard to change as it is designed to optimize the layout in general (minimize the total link path length in the connected component). However, I have included an experimental feature to correctly display Sankeys with many parallel links - this will not necessary offer the best layout for regular Sankeys though. In the sankey.js, there is a function called computeLinkDepths which sorts the links in ascending order at the sources and subsequently at the targets. This leads to some ordering conflicts (two source nodes going to the same target, with links of different value, will not both have their top link at the top at the target), which are then solved be the least in number. In case of parallel links, this creates a messy layout. To solve this, I have included a toggle for parallel rendering. This is a bit of an advanced feature and I encourage you to try to understand the sankey.js code structure before you turn this on. How to turn it on? First, make sure that in your input string all parallel links are sorted by value and grouped by source node. An example of this would be:
{"sankey":{"nodes":[{"name":"a"},{"name":"b"},{"name":"c"},"name":"d"}],"links":[{"source":0,"target":1,"value":10},{"source":0,"target":1,"value":70},{"source":0,"target":1,"value":80},{"source":0,"target":1,"value":100},{"source":0,"target":1,"value":200},{"source":0,"target":1,"value":700},{"source":0,"target":1,"value":800},{"source":0,"target":2,"value":20},{"source":0,"target":2,"value":30},{"source":0,"target":2,"value":40},{"source":0,"target":2,"value":300},{"source":0,"target":2,"value":400},{"source":0,"target":3,"value":60},{"source":0,"target":3,"value":600},{"source":2,"target":3,"value":50}]},"params":[0.5,0.25,0,0]}
Then open up a console in your browser and turn on parallel rendering by typing the following: parallelrendering=true. Then hit the Draw Sankey button to redraw the diagram and you should be seeing your Sankey with many parallel links loaded correctly. You can turn it off either by refreshing the page or setting it back to false in the console. Have fun!
UDPATE 4: Added option for adjusting decimals for nodes and links, as well a counter for the node editor on the right, making it easier to create larger diagrams.
UPDATE 5: Sankey Diagram Generator is now on GitHub. You can ubmit feature requests and follow the development there.
Made with D3.js & Dragdealer. If you would like to show your support for my work, please consider a small donation. For a more advanced, applied implementation of this tool, see the Food Energy Flows Exploratorium.