
SUMMARY
Note: Rightfully reposting as Trolls have made invisible with downvotes.
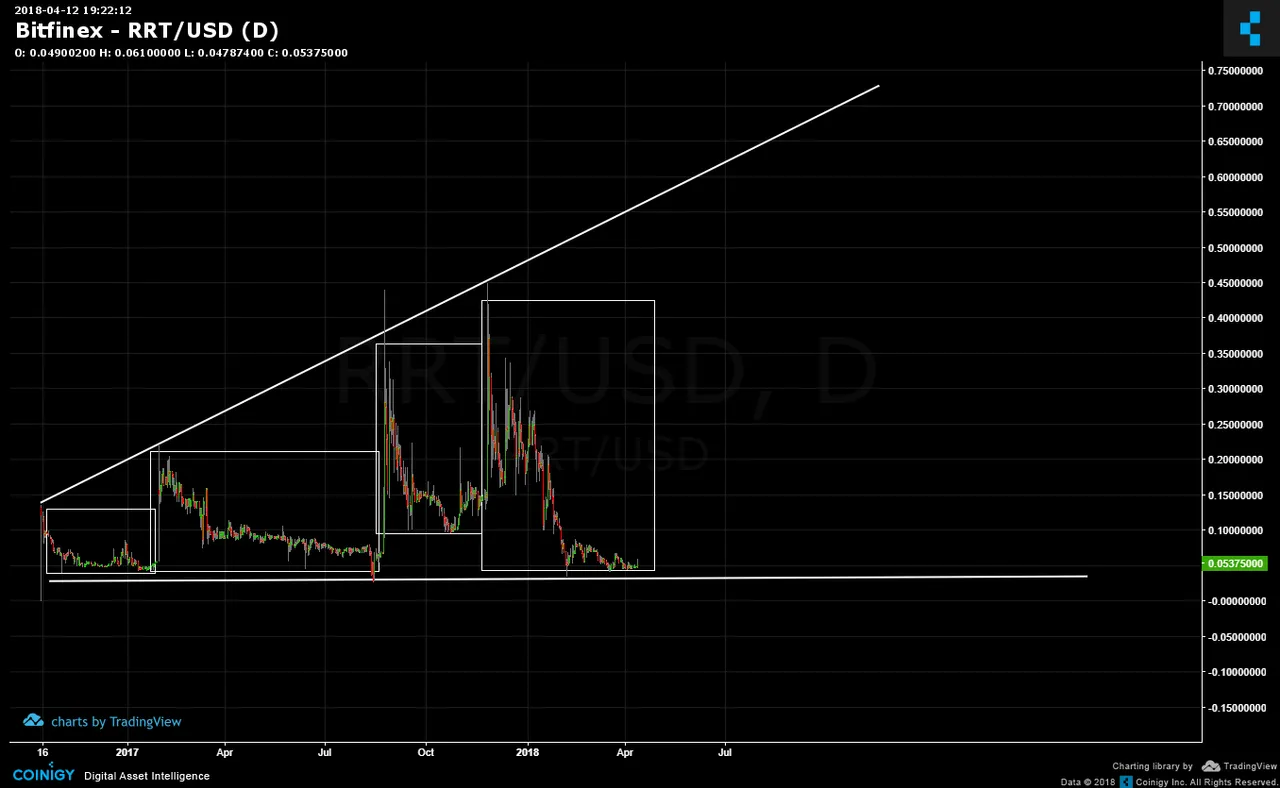
Here is a chart of RRT with its broadening pattern. Note the series of squares marking out the fractals. Each fractal reached for the top trenline and decline to the bottom. Where is the price currently? It's sitting on the lower trendline. So would now be the ideal time to take SELL actions or BUY action?
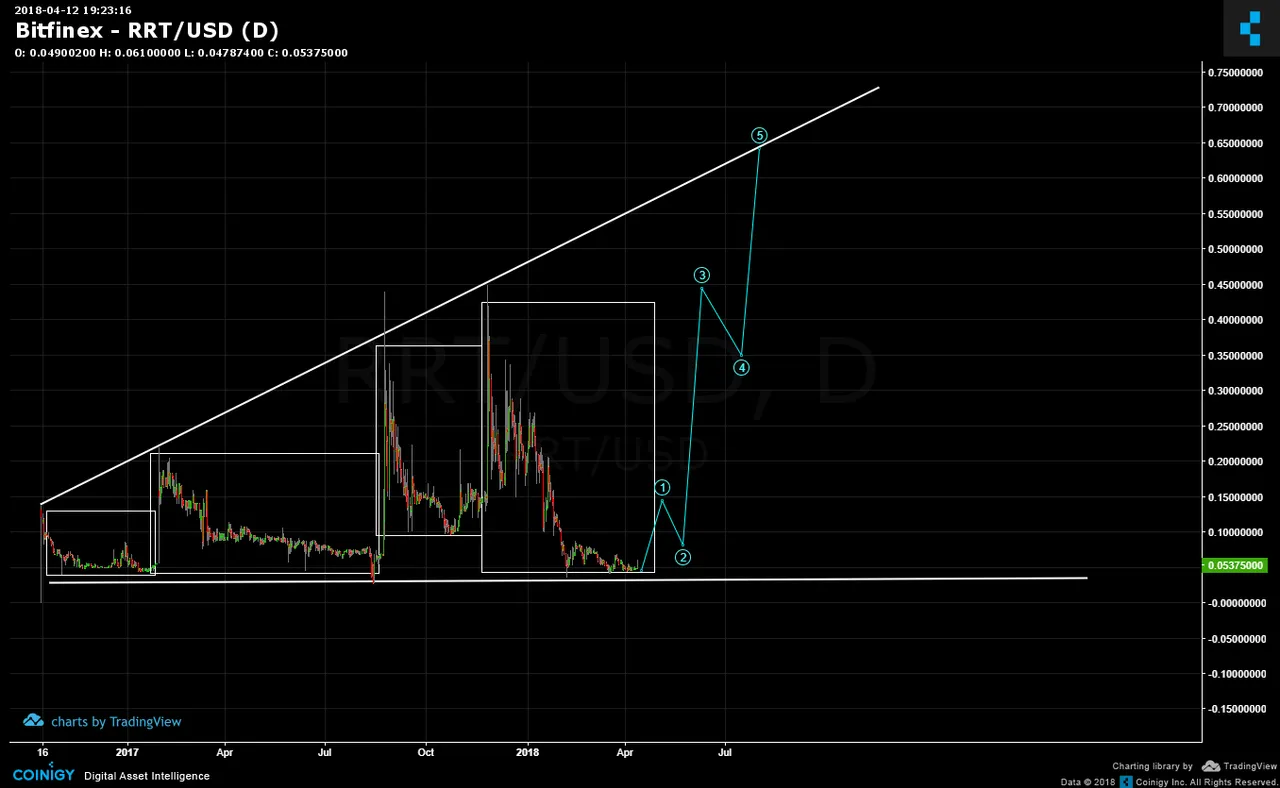
Using the preponderance of evidence, the blue impulse waves show the projected pathway towards the upper trendline and the time line is into July/August. The ascent seems quite vertical and that's quite normal given the Hurry Up & Wait syndrome. All impulses are near vertical and quick while the corrections are very long.
Here is the RRT/BTC pair. Again, fractals abound! The white square shows a pair of downward wedges, a small and a large. The blue box thus far only contains the small wedge and per fractal, a larger wedge could be formed. The white arrow shows the near vertical ascent in five blue impulse waves and the decline to complete the larger wedge. Would now be an ideal time to buy or sell RRT?

Legal Disclaimer: I am not a financial advisor nor is any content in this article presented as financial advice. The information provided in this blog post and any other posts that I make and any accompanying material is for informational purposes only. It should not be considered financial or investment advice of any kind. One should consult with a financial or investment professional to determine what may be best for your individual needs. Plain English: This is only my opinion, make of it what you wish. What does this mean? It means it's not advice nor recommendation to either buy or sell anything! It's only meant for use as informative or entertainment purposes.
Please consider reviewing these Tutorials on:
Elliott Wave Counting Tutorial #1
Elliott Wave Counting Tutorial #2
Elliott Wave Counting Tutorial #3
Laddering and Buy/Sell Setups.
Laddering Example with EOS
Tutorial on the use of Fibonacci & Elliott Waves
@haejin's Trading Nuggets
Essay: Is Technical Analysis a Quantum Event?
Follow me on Twitter for Real Time Alerts!!
Follow me on StockTwits for UpDates!!
--
--

