
SUMMARY
On February 3rd, I had posted the below chart as an emphasis that a correction for Cryptos is often a slow or slower than expected process. The blue arrow represented the shorter cycle while the white arrow would better reflect the the "Hurry Up & Wait" nature of an Altcoin. Most Cryptos have an inherent tendency to be extremely lethargic in the correction.
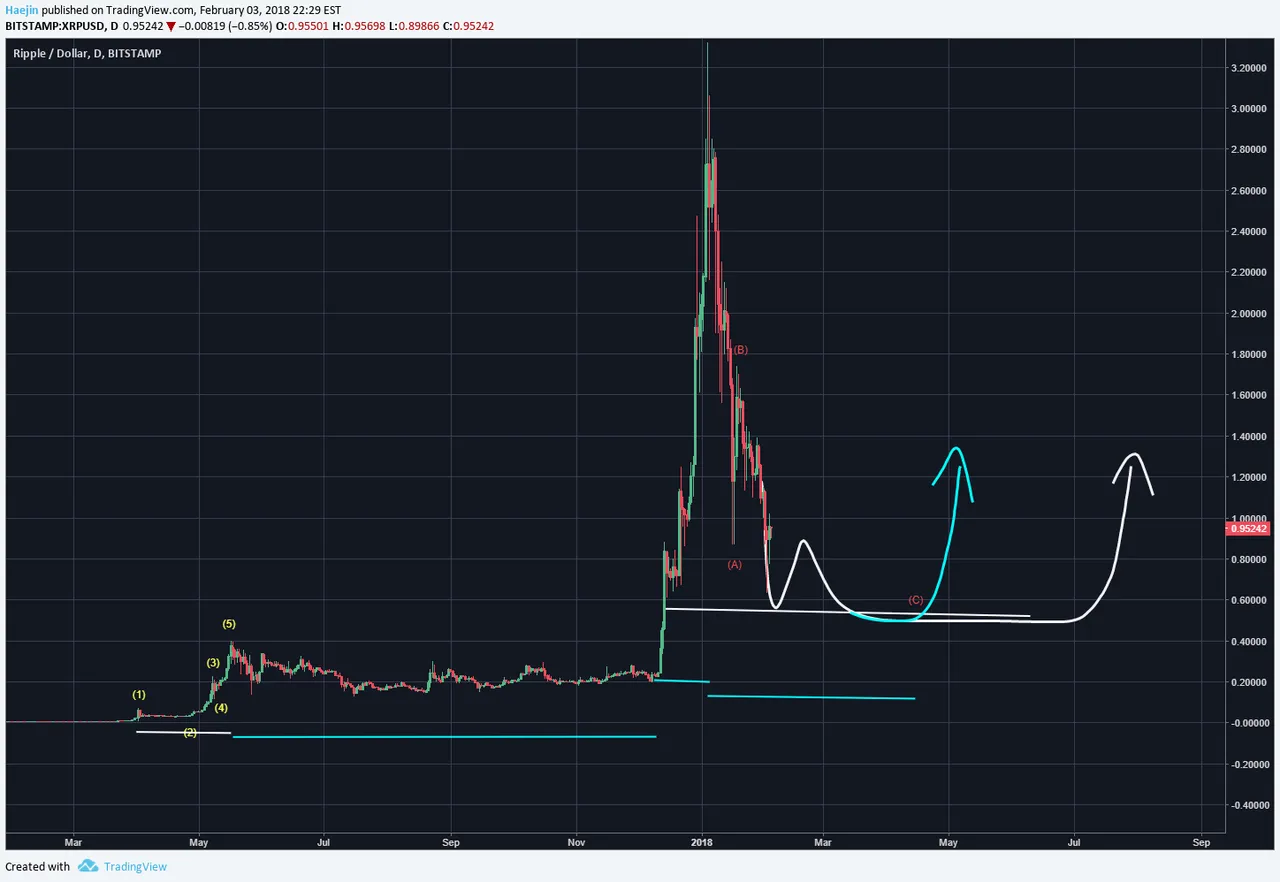
The below chart shows Ripple going sideways and currently it reflects the blue arrow pathway as shown in the first chart. The blue wxyxz represent a potential price pathway that would likely lead to a lower low for the completion of the white Z wave. These complex corrections are always a bit of a challenge for newbie Elliticians to label. But, like anything, practice makes it easier. Many perceive a correction bottom as an event; for instance the instant when the wedge is breached; many newbies feel the bottom can be marked. Unfortunately, a correction bottom is not an event but rather a process. As the blue wxyxz shows, the bottoming process for Cryptos can be quite extended and this is when awareness of alternates carries value.

Legal Disclaimer: I am not a financial advisor nor is any content in this article presented as financial advice. The information provided in this blog post and any other posts that I make and any accompanying material is for informational purposes only. It should not be considered financial or investment advice of any kind. One should consult with a financial or investment professional to determine what may be best for your individual needs. Plain English: This is only my opinion, make of it what you wish. What does this mean? It means it's not advice nor recommendation to either buy or sell anything! It's only meant for use as informative or entertainment purposes.
Please consider reviewing these Tutorials on:
Elliott Wave Counting Tutorial #1
Elliott Wave Counting Tutorial #2
Elliott Wave Counting Tutorial #3
Laddering and Buy/Sell Setups.
Laddering Example with EOS
Tutorial on the use of Fibonacci & Elliott Waves
@haejin's Trading Nuggets
Essay: Is Technical Analysis a Quantum Event?
Follow me on Twitter for Real Time Alerts!!
Follow me on StockTwits for UpDates!!
--
--

