
Today's chart of the day is Redd Coin (RDD). I'm watching the entire crypto market for a bottom but few are 'impulsive' according to Elliott Wave analysts look for. And, I still see new lows in many large caps from Bitcoin, to Ethere, to Ripple.
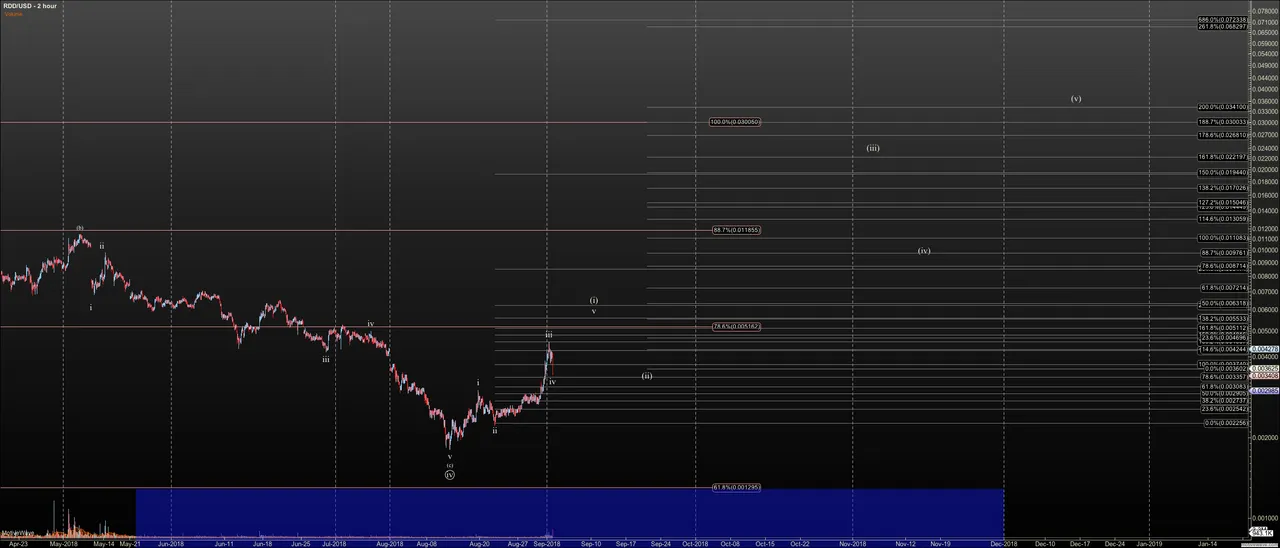
Redd is taking a shot though. If you look at my fib levels on my chart the .0001295 level in pink and the blue zone, has always been key. We have hovered over it without entering this area. Further, I have a hard time making out the iv in wave C. While these two facts remain an issue- that is downside may be incomplete and it needs a clearer fourth, I now have an early break of resistance proceeding form a 5 wave diagonal in wave 1. Now, it is key for us to hold near today's low, and not breach .003. If we do, this is not impulsive. I'll watch for a diagonal to form, or for it to break down into the long term support zone.
If we do see an impulse or larger diagonal complete, we'll have a key swing entry at wave (ii).
Click to open in a new tab to see larger.
Note that free 15 day trials are available for our trading room and community on Elliott Wave Trader, where I am a full time analyst. You'll rub nose with, professional, amateur and traders in the learning process, while getting trade calls and ongoing direction for the market. No credit card is needed for a trial.