I started at doc/examples directory for the soffit project, and
my first two examples are there. Unfortunately, only one of them looks any good.
The way I finally convinced graphviz to lay things out the way I wanted is pretty gross. First, lay out each graph individually, and then copy the position from the Agraph object that does this back to the original networkx graph:
def position( graph ):
    """Render a graph with 'neato', and return its bounding box."""
    agraph = to_agraph( graph )
    agraph.layout( prog='neato' )
    for n in graph.nodes:
        graph.nodes[ n ]['pos'] = agraph.get_node( n ).attr['pos']
    for (s,t) in graph.edges:
        graph.edges[s,t]['pos'] = agraph.get_edge( s, t ).attr['pos']
    return [ float(i) for i in agraph.graph_attr['bb'].split( ',' ) ]
Call this for each graph to get its size:
    (_, _, leftX, leftY) = position( l )
    (_, _, gX, gY) = position( g )
    # FIXME: initialize r with l's positions
    (_, _, rightX, rightY) = position( r )
    # FIXME: initialize h with g's positions
    (_, _, hX, hY) = position( h )
Then rewrite the positions so that they're laid out in the format I want:
    centerX = max( leftX, gX )
    centerY = max( gY, hY )
    # Lower left - Bring g up to the center line
    reposition( g, centerY - gY, 0.0 )
    # Lower right
    reposition( h, centerY - hY, centerX + 10 )
    # Upper left
    reposition( l, centerY + 10, 0.0 )
    # Upper right
    reposition( r, centerY + 10, centerX + 10 )
Here's the code that unpacks and repacks the strings to do the offset:
def reposition_pos( pos, yOffset, xOffset ):\
    return " ".join(
        ",".join( [ str( float( y ) + yOffset ),
                    str( float( x ) + xOffset ) ] )
        for coord in pos.split( " " )
        for (y,x) in [ coord.split( "," ) ]
    )

def reposition( graph, xOffset, yOffset ):
    """Update all pos attributes to a different location."""
    for n in graph.nodes:
        graph.nodes[ n ]['pos'] = reposition_pos( graph.nodes[n]['pos'],
                                                  yOffset, xOffset )
    for (s,t) in graph.edges:
        graph.edges[s,t]['pos'] = reposition_pos( graph.edges[s,t]['pos'],
                                                  yOffset, xOffset )
Finally, put all the graphs back together into a single graph, and plot that:
    collection = nx.disjoint_union( l, r )
    collection = nx.disjoint_union( collection, g )
    collection = nx.disjoint_union( collection, h )
    agraph = to_agraph( collection )
    agraph.draw( outputFile, prog="neato", args="-n" )
I omitted the steps to color and label the graph, which is just a matter of adding attributes.
Here is reproduces the example in "Pushouts on Labeled Graphs", though Soffit does not permit multiple edges between nodes:
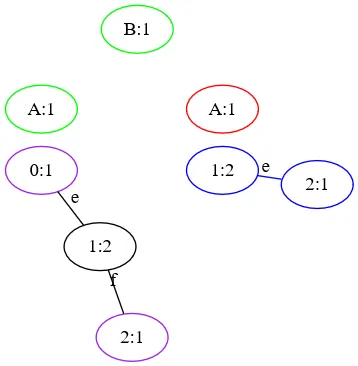
As seems standard with graphviz, edge label placement is awful.