The #1 question about graphviz seems to be "why can't I get it to lay out my clusters in the way I want", judging from the number of StackOverflow questions I see.
I wrote some code in Soffit to enumerate all the matches for a particular rule and spit them out as a sequence of graphviz Dot files (and then use graphviz to convert to SVG.)
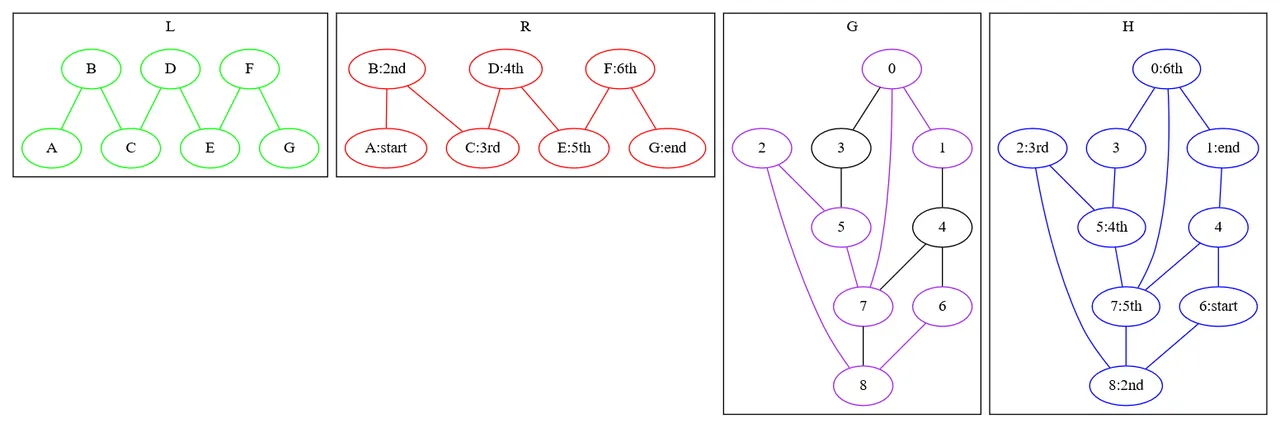
green L = left graph (pattern)
red R = right graph (changes to make)
black G = graph on which to apply the rule, purple nodes are those picked by the match
blue H = effect of applying the match
Two problems with this approach:
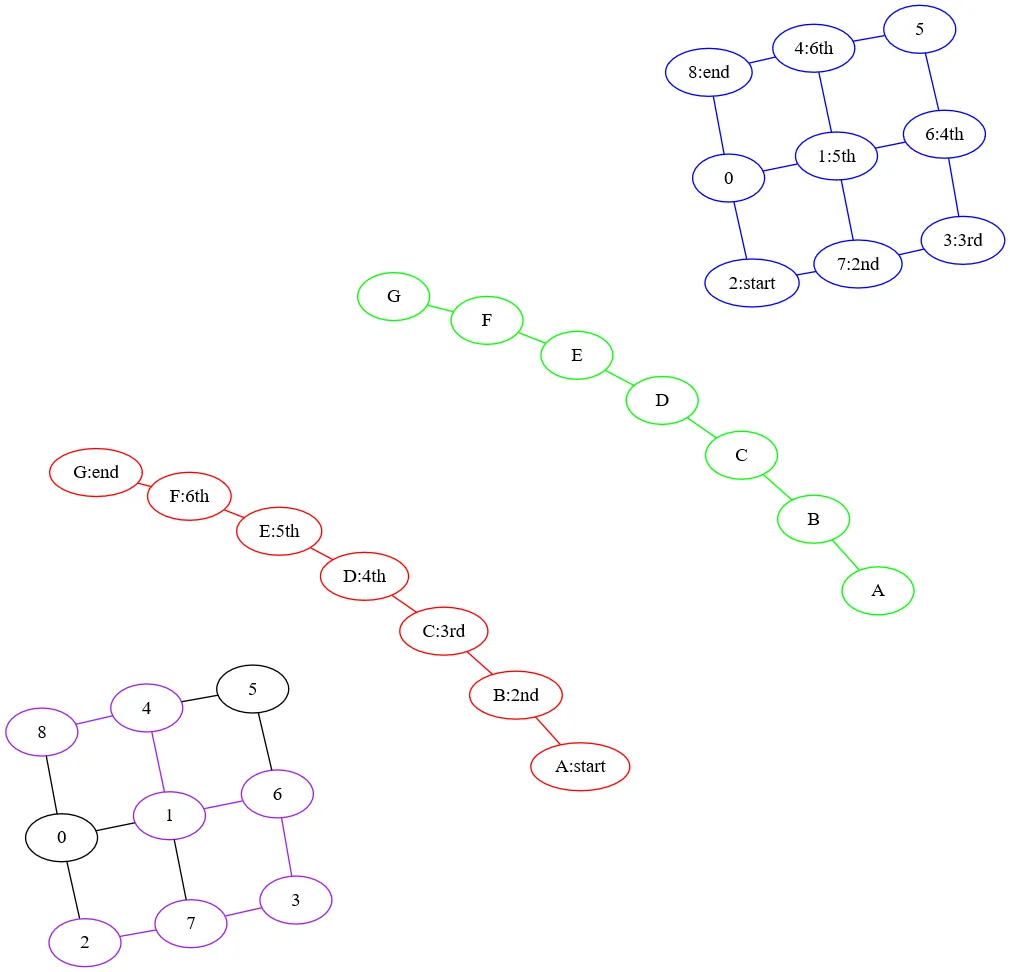
- I can't figure out how to get a nice "upper-left" "upper-right" "lower-left" "lower-right" placement of the four graphs.
- The pygraphviz library puts things into the graph in random order (I think based on how they hash?) so it's inconsistent within a batch!
Using 'neato' instead of 'dot' does a better job on each figure but the overall composition is worse, and it doesn't know how to draw cluster boundaries.
I can probably clean these up and get a better display if I work at it, but I feel my next example is just going to be starting over from scratch.
Might try to do a visualization of "all the ways to take a path of length N along the square graph" if I can figure out a not-too-painful way to do so.
Code for example: python -m soffit.display --matches "A--B--C--D--E--F--G" "A--B--C--D--E--F--G; A[start]; B[2nd]; C[3rd]; D[4th]; E[5th]; F[6t; G[end];" "X1--Y1--Z1; X2--Y2--Z2; X3--Y3--Z3; X1--X2--X3; Y1--Y2--Y3; Z1--Z2--Z3;"
Source repository: https://github.com/mgritter/soffit
Today's changes: design document additions, semantics document, changes code to only do injective matches, graph drawing