Namaste to all #hive and #inleo community members. 🙏
First of all sorry for not sharing my analysis last week.
But as per our previous analysis, all the levels we discussed worked quite accurately. This is why I give so much importance to technical analysis and am always ready to learn new things about it. I am sure you are learning something new and better from all my analysis.
Click here to go through my previous #analysis.

Image by Kerfin7 on Freepik | Edited on Canva
Important points that we discussed in our previous analysis are:
- Technically this price structure is weak.
- Price will remain under pressure until it breaks above the level of 28200.
- 26500 and then 26000 will be acting as immediate important #support levels.
- One can go long for smaller targets with smaller quantities if the price breaks above the level of 27515.
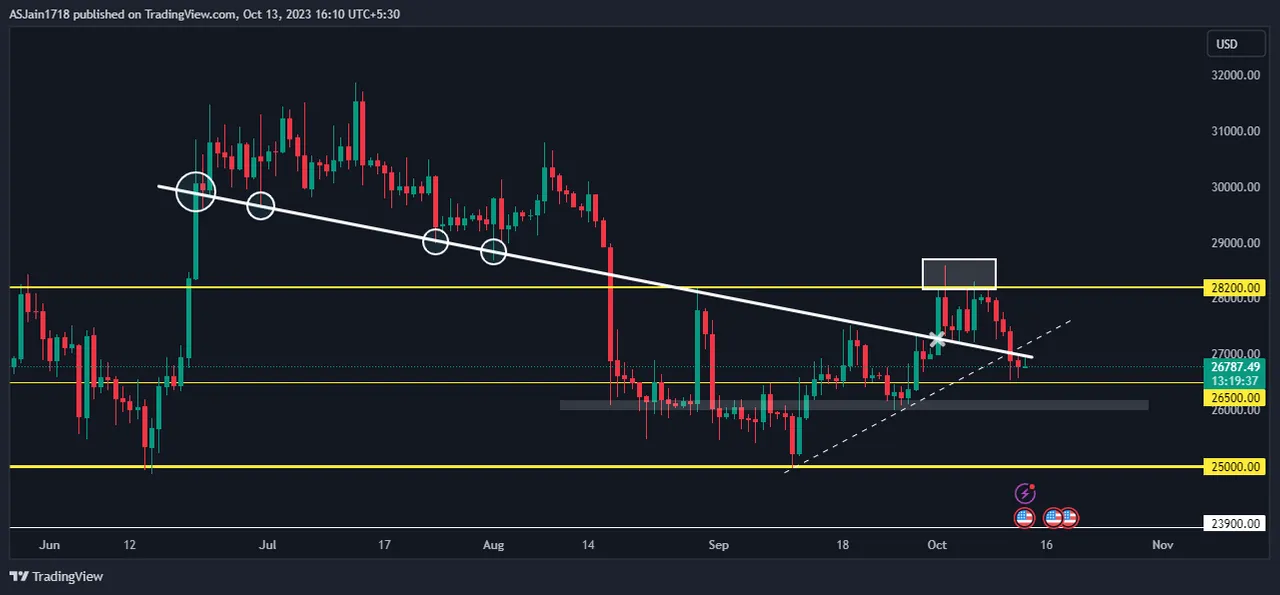
Image by Tradingview | 1 Day time frame chart.
Let us now take another deep dive into the Bitcoin (#BTC/#USD) chart and see where it could be headed in the coming days.
The price action of the last 2 weeks was nothing short of a roller coaster ride. After breaking our trend line which you can understand by looking at the white cross mark in the chart shown above, the price moved upwards very fast and broke above our key resistance level of 28200 which you can understand by looking at the white rectangular area shown in the above chart. But unfortunately, that was a fake breakout or you can say a trap.
Then due to continued selling it came back below our bold white trendline and the technical support of this current higher-highs formation which you can understand through the white dashed trendline in the chart shown above.
Now let's understand the strategy to trade Bitcoin for the next few days.
I would not venture into any fresh buying unless the price is sustained at least above the level of 27500. However, a key #resistance level for a bigger movement would be 28500.
So for now since the current price action suggests #selling, I will initiate a sell order when the price breaks below 26500 and will remain in my position until either the price reaches its next support or a trend change signal appears in a 4-hour time frame.
For #buying as I said, I will be interested in buying only when the price trades above the 27500 level that too in a higher-highs formation. The SL will always be the previous major swing in a 2 or 4-hour time frame.
Since the current price action position is technically indicating weakness, I will closely monitor the price action at current levels. If the price fails to sustain above the level of 26500 then sellers will easily take the bitcoin price down to the level of 26000 which will be the last support of this higher high formation which if broken the #Bitcoin could go down big for sure.
Lastly, as I always say, Instead of thinking like a buyer or a seller, think like an #opportunist. No matter which direction the price moves, we have to confirm the follow-up movement before placing any order.