2022 is behind us and it is time for a review of the HIVE tokenomics and the overall inflation for the month and the year.
After the collapse of FTX in November, December continued to go sideways and then down even more. The year ended with a bear market in full force. Let’s take a look how is this impacting the overall Hive tokenomics.
The projected inflation for 2022 is around 7% on a yearly basis, or 0.58% on a monthly basis. As for the title said Hive ended the year with 6.8% inflation, or just slightly bellow the projected one.
The thing is Hive has a double currency system, HIVE and HBD, with conversions between them that add or remove HIVE from circulation on top of the regular inflation. Furthermore, the decentralized hive fund DHF, that serves as a DAO converts the HIVE in HBD that is in the DHF. The @hbdstabilizer has also grown in the last year and it playing an important role in the overall tokenomics, making conversions and trading on the internal market.
Because of this additional mechanics the HIVE inflation and supply can be drastically different in real time then the regular/projected one.
To be able to follow the HIVE supply we need to take a look at all the different ways HIVE is created, author, curation, witness rewards, conversions etc, then net that out with the HIVE burned from conversions, accounts fees, null transfers etc. To get the virtual supply we need to do the same for the HBD supply as well.
HIVE Created
Here is the chart.
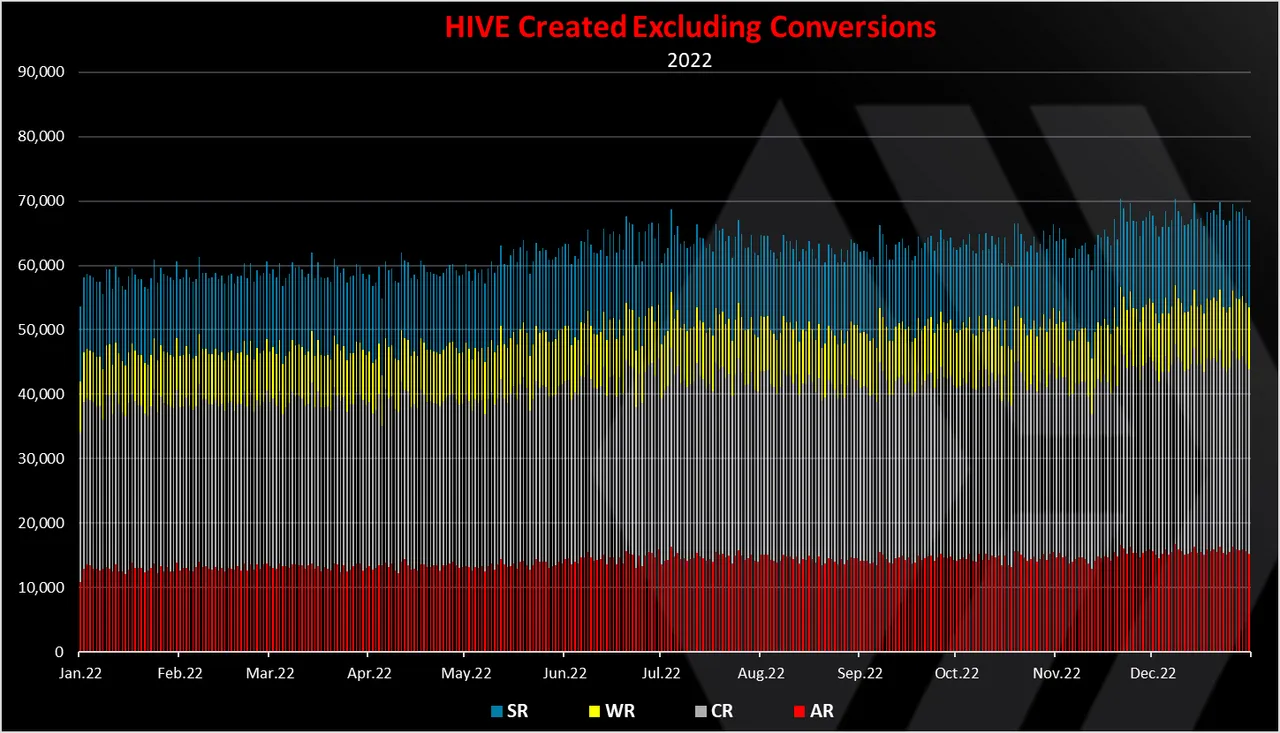
The chart above includes:
- Author rewards
- Curation rewards
- Witness rewards
- Staking rewards
These are the regular ways new Hive enters circulation, and all of them are through vested HIVE.
Thing is the conversions are playing a major role in the ecosystem. Here is the chart again, including conversions.
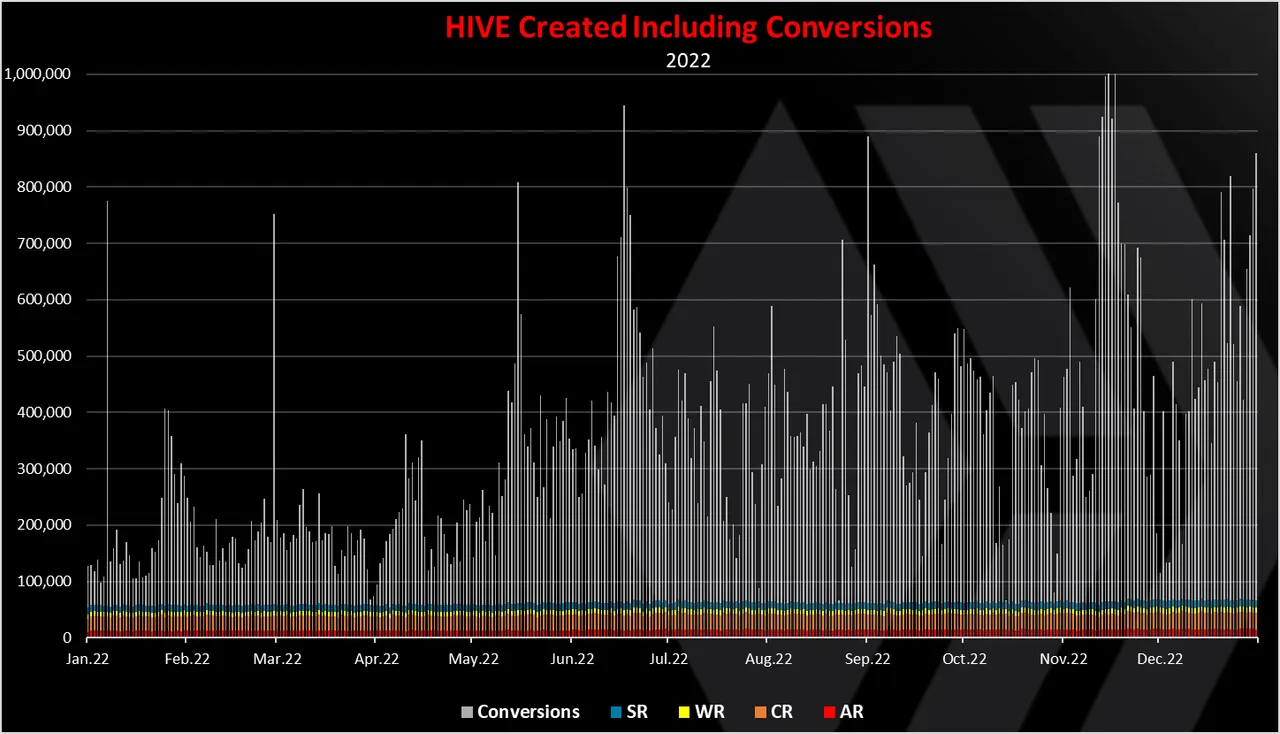
We can notice that the HBD to HIVE conversions are the dominant in the chart. Thing is this work both ways and a big part of them is converted back to HIVE, especially through the work of the stabilizer.
The regular inflation is around 65k HIVE per day. In December there was on average around 420k HIVE per day from HBD conversions, although as noted most of them are converted back to HBD.
HIVE Removed From Circulation
Here is the chart.
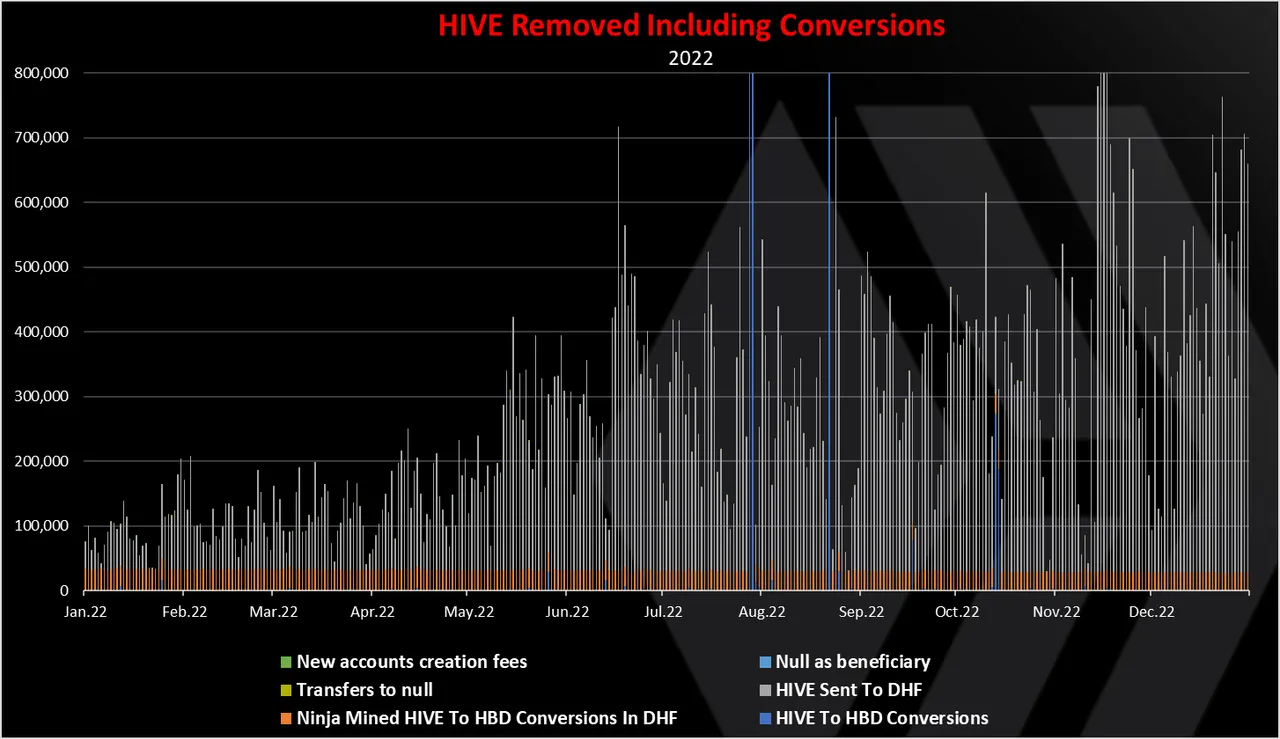
The above takes into consideration six different ways of HIVE removed
- Ninja Mined HIVE To HBD Conversions In DHF
- HIVE transfers to DHF and converted to HBD
- Transfers to null
- Null as post beneficiary
- New accounts creation fee
- HIVE to HBD conversions
The HIVE transfers to the DHF are now dominant. These are transfers made by the stabilizer. We can see a few spikes in the HIVE to HBD conversions back in August and one smaller one in September. These were due to the increase in the HBD price.
Historical HIVE Supply
When all the above is added and removed, we get this chart for the all-time HIVE supply.
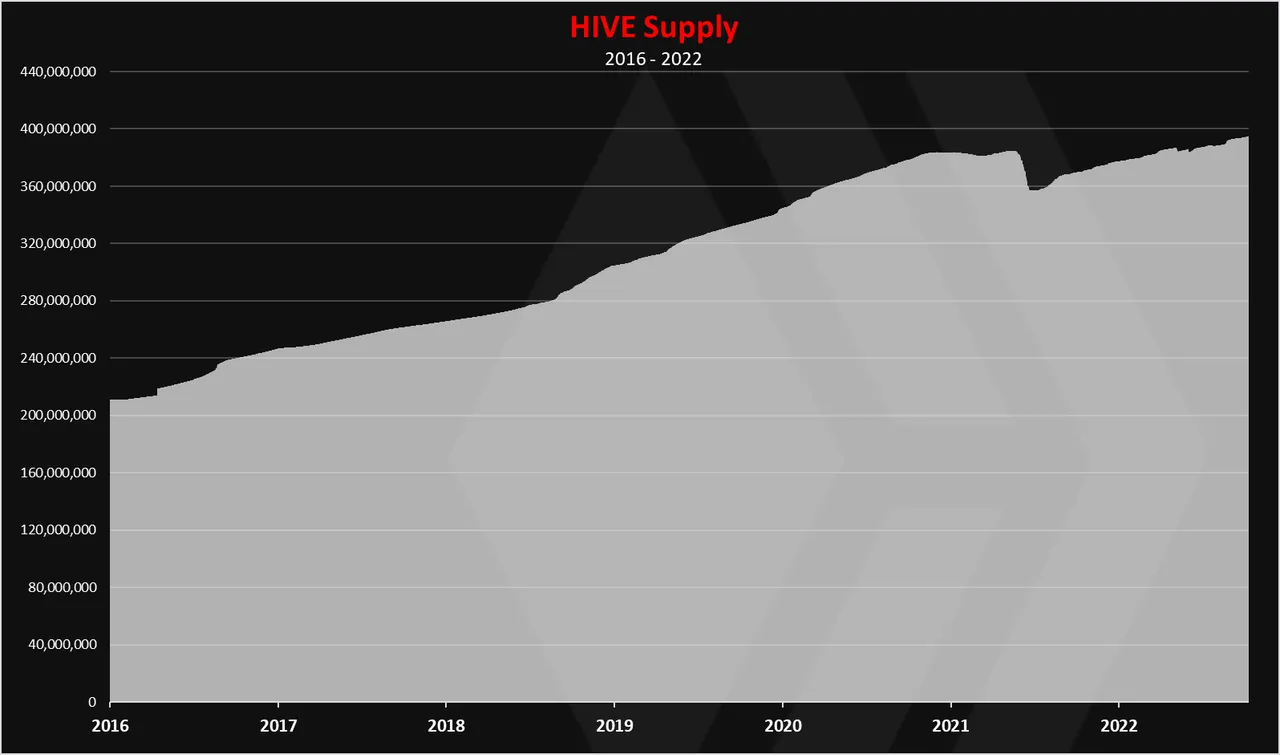
Up until August 2021, the supply was almost steadily increasing with a small fluctuation. Then a huge drop in the supply in August and September 2021.
In 2022 we can see a small drop in August because of the increase in the HBD supply and an increase in the last month because of the opposite trends.
HBD Supply
Here is the chart for the HBD supply.
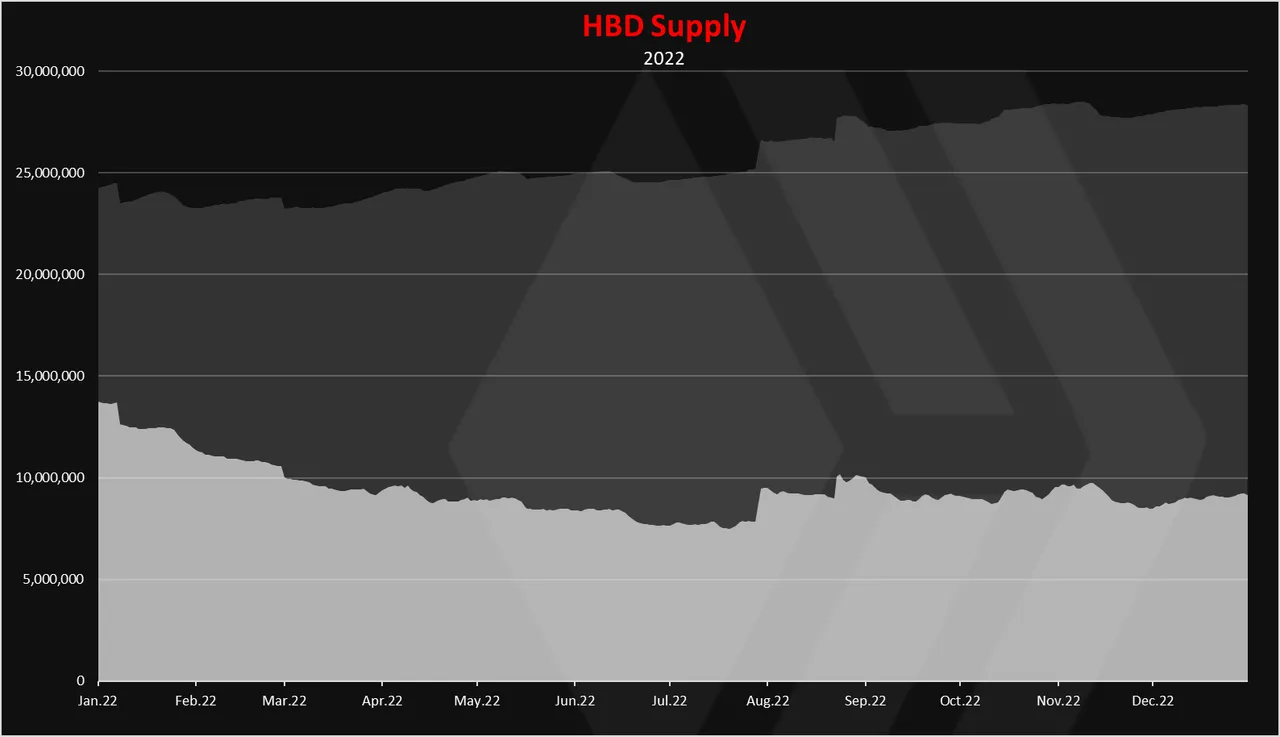
The light color is HBD in the DHF.
This is not freely circulating HBD and only enters circulation when payouts to the DHF workers are made.
HBD is being created and removed in a various way, but the conversions play the major role here in both directions. Other ways HBD is created is DHF proposal payouts, author rewards and interest.
Overall, the HBD supply has went down in 2022, with some spikes in August when the HBD price increased. At the beginning of the year there was more than 14M HBD in circulation and now we are at 9M.
Since August the HBD supply has constantly been around the 9M mark. In December the HBD supply has increased a bit from 8.5M to 9M, showing that there is still a demand for HBD.
Virtual HIVE Supply
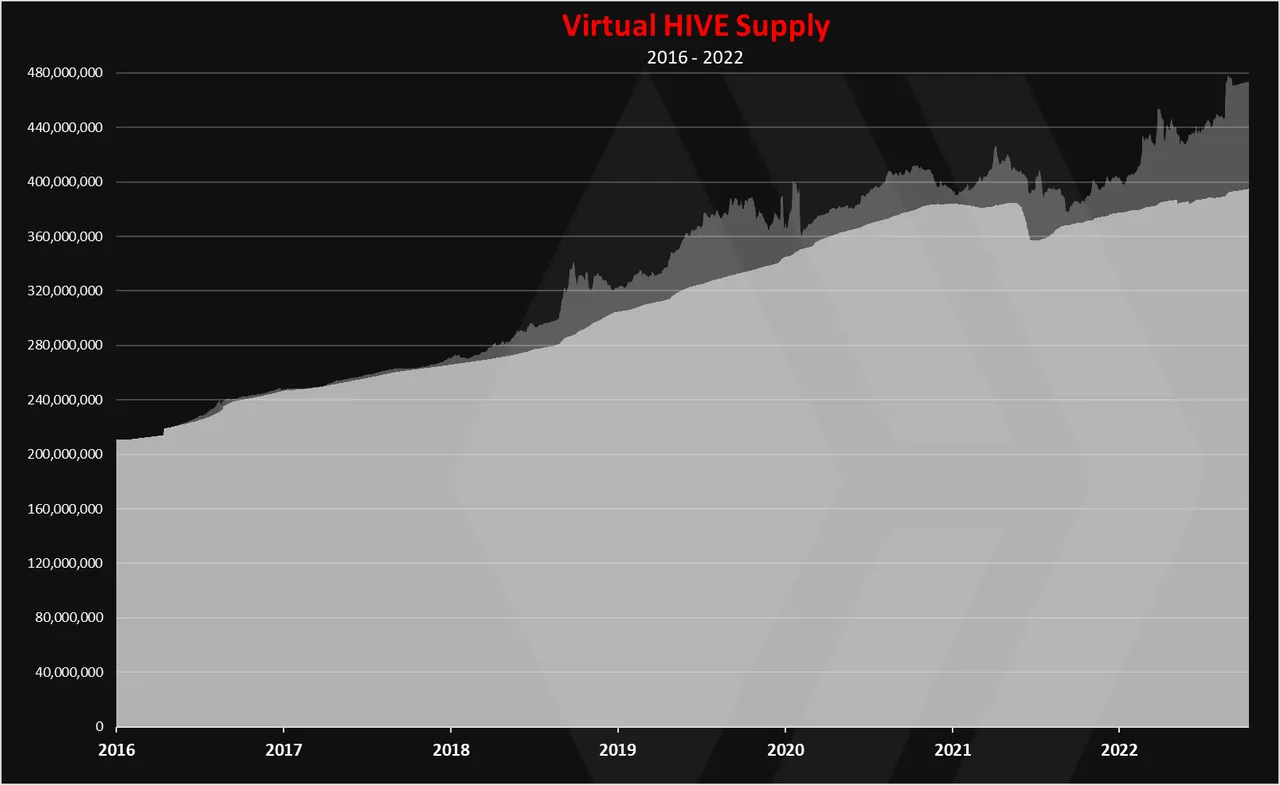
When we add the HIVE equivalent supply from the HBD to the HIVE supply we get the chart bellow.
When we zoom in 2022 we get this:
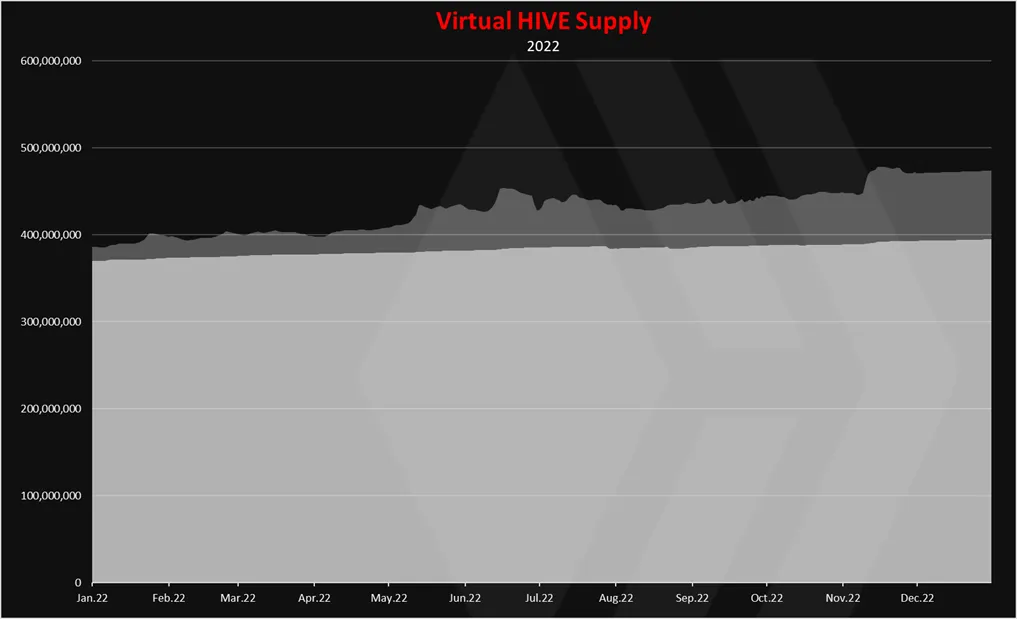
The light color is HIVE that in theory can be converted from HBD at the current market prices for HIVE.
We can see that the virtual supply fluctuates a lot, mostly because it is tied to the price of HIVE. As the price of HIVE drops, the virtual supply increases and the opposite.
In 2022 the virtual supply has increased because of the drop in the HIVE price.
Monthly Inflation
If we plot the monthly inflation, we get this.
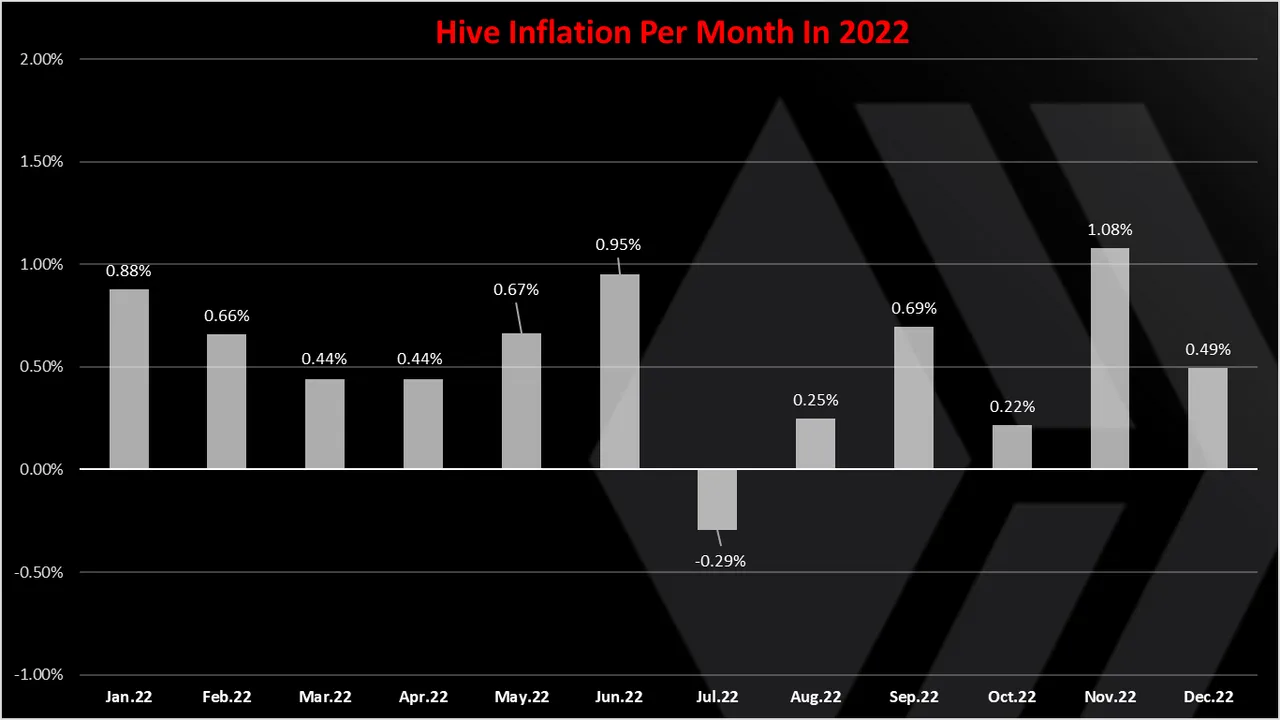
We can see that the highest monthly inflation was in November, with 1% added in that month, and the lowest has been in July when HIVE was deflationary. December has ended the year with 0.49% inflation, or slightly bellow the projected one. This is mostly because of the restored demand for HBD and the negative conversions done from the stabilizer.
A reminder that these are monthly numbers, to get the yearly equivalent we need to add the monthly ones.
In terms of absolute numbers the HIVE supply in December has increased from 393.1M to 395M, adding 1.9M more HIVE in circulation. In comparison November had 4.4M.
Yearly Inflation
The yearly inflation projected and realized looks like this.
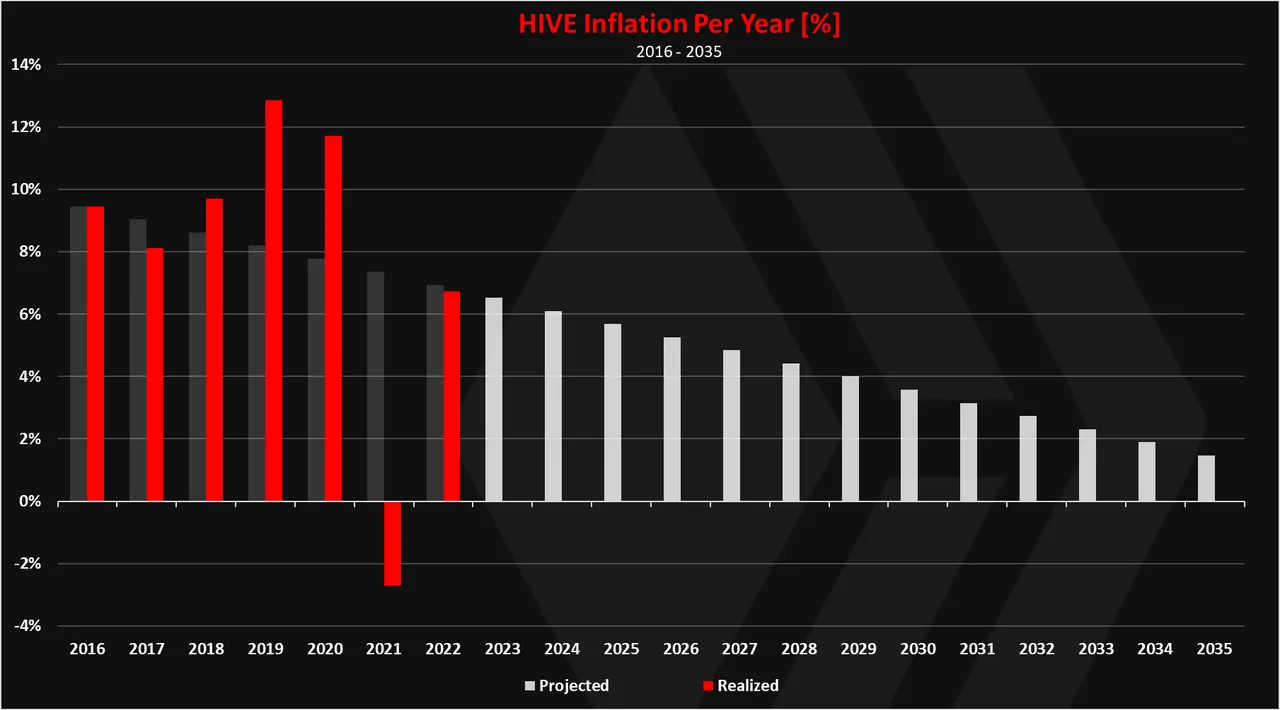
The inflation for 2022 is 6.8%!
It is almost the same as the projected one of 7%. Having in mind the overall bear market we can say this is a success for HIVE, especially having in mind the last year when HIVE was deflationary with -2.7%.
The year started with 370M HIVE and ended up with 395M HIVE, adding a 25M more HIVE in circulation.
If we take a look a the previous cycles we will see that during the bear years the HIVE inflation was higher than the projected one, for example in 2019, it was 12% with 45M more tokens added.
Net HIVE Created By Category In 2022
Here is the new HIVE put in circulation by category in 2022.
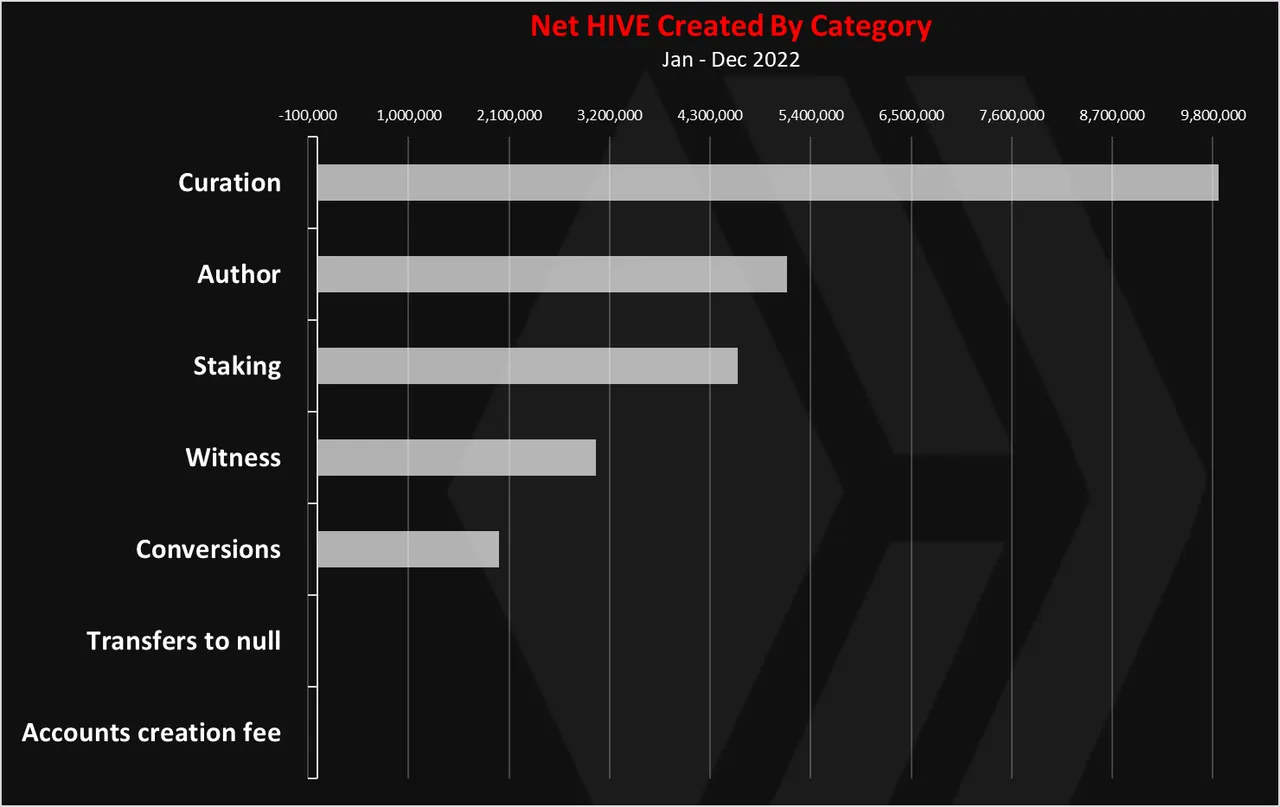
This is a summary for the whole year.
Approximately the numbers looks like this:
- 10M - Curation rewards
- 5M – Authors rewards
- 4.5M – Staking rewards
- 3M – Witnesses
- 2M – Conversions
As we can see the curation rewards are on the top, with almost 10M.
One important thing to takeaway from this chart are the numbers for conversions. The whole year ended up with only 2M added from conversions that is a success for the ecosystem having in mind the overall market conditions. The @hbdstabilizer is now the main player when it comes to conversions and adding removing HIVE/HBD in the DHF.
Another note about the conversions would be the ones that are happening in the DHF from the ninja mine, that on a yearly level for 2022 are 11M HIVE. These are not market driven so to speak but are just technical converting HIVE to HBD, so the DHF can use the funds. These are set to end in five years, out of which two already have passed.
The HBD in the savings has kept growing throughout the 2022 and this is another important metric that has helped the overall HIVE supply.
The inflation for 2023 is set to 6.5%, and it will be interesting to see how things go in this year. The HBD supply has already contracted in 2022, and there is a chance for more HIVE to be converted to HBD, putting pressure on HIVE. As always, we will be closely following the process here with the monthly reports.
All the best
@dalz
Consider supporting me as a witness: https://peakd.com/me/witnesses