There’s a bit of a kerfuffle going on about whether Momentum is going to launch a mass purge of the PLP. I doubt they have the organisational skills, however I was interested in just how long members of the PLP had served as MPs and what the politics of the Party were when originally selected. So I scraped a list of the parliament site and organised it as a table. This note talks about the profile of the longevity of PLP members, and which leadership made them. Further thoughts on the political consequences have put in the comments section.
Here is a chart showing how many of today’s PLP entered the House of Commons by date of entry.

PLP (2017) by date of entry to the Commons
Does this tell us anything interesting?
- Most MPs are elected in a General Election. Only 13% were elected at Bye-elections. This is important because the NEC has more power and the local party less when selecting candidates for a bye-election.
- Intakes are larger when Labour wins. Duh!
- The 46 new comers in 2017 is higher than I’d expected.
- There are a surprisingly high number of new entrants in 2010 under Brown’s leadership.
- There remain over 70 members elected under Blair’s leadership. Much of this is because of the newly won seats in 1997 although many of those are no longer in the Commons. i.e. the class of 97 remains large despite attrition from defeat, retirement and shamefully imprisonment.
- Over 25%, including Jeremy Corbyn and Dianne Abbot have served for 20 years or more, it includes all the ’97 intake elected in the Blair landslide.
- 45% of Labour’s MPs are women.
- 10 MPs are re-entrants; I have used the date of first entry.
- Labour won 12 bye-election between 2010 & 2015, but most were defences.
This next diagram shows the number of MPs in the 2017 PLP by my classification of the dominant leadership faction. It shows the overwhelming majority of MPs were selected under a right wing (or moderate) hegemony.
We can also note that today the Party has close to 600,000 members today but we should remember that under Blair in 1997, the membership was nearly 400,000 but it didn’t last and by 2010, it had fallen to around 150,000. Sadly, its hard to know the average membership longevity of the Party nationally but it will be closer to two years than twenty. It has to be asked if these longer serving MPs still represent their local Parties.

PLP (2017) by date of entry to the Commons, classified by hegemonic faction
An alternative way of looking at this is by the Leader of the Party.
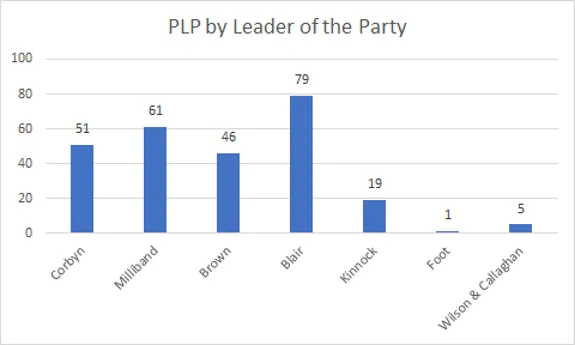
PLP (2017) by date of entry to the Commons, grouped by Leader