I was wrong about the buying opportunity in my last post, it was simply a bear trap. Since I was wrong I decided to analyze further to see what I missed, which was the bigger picture below...
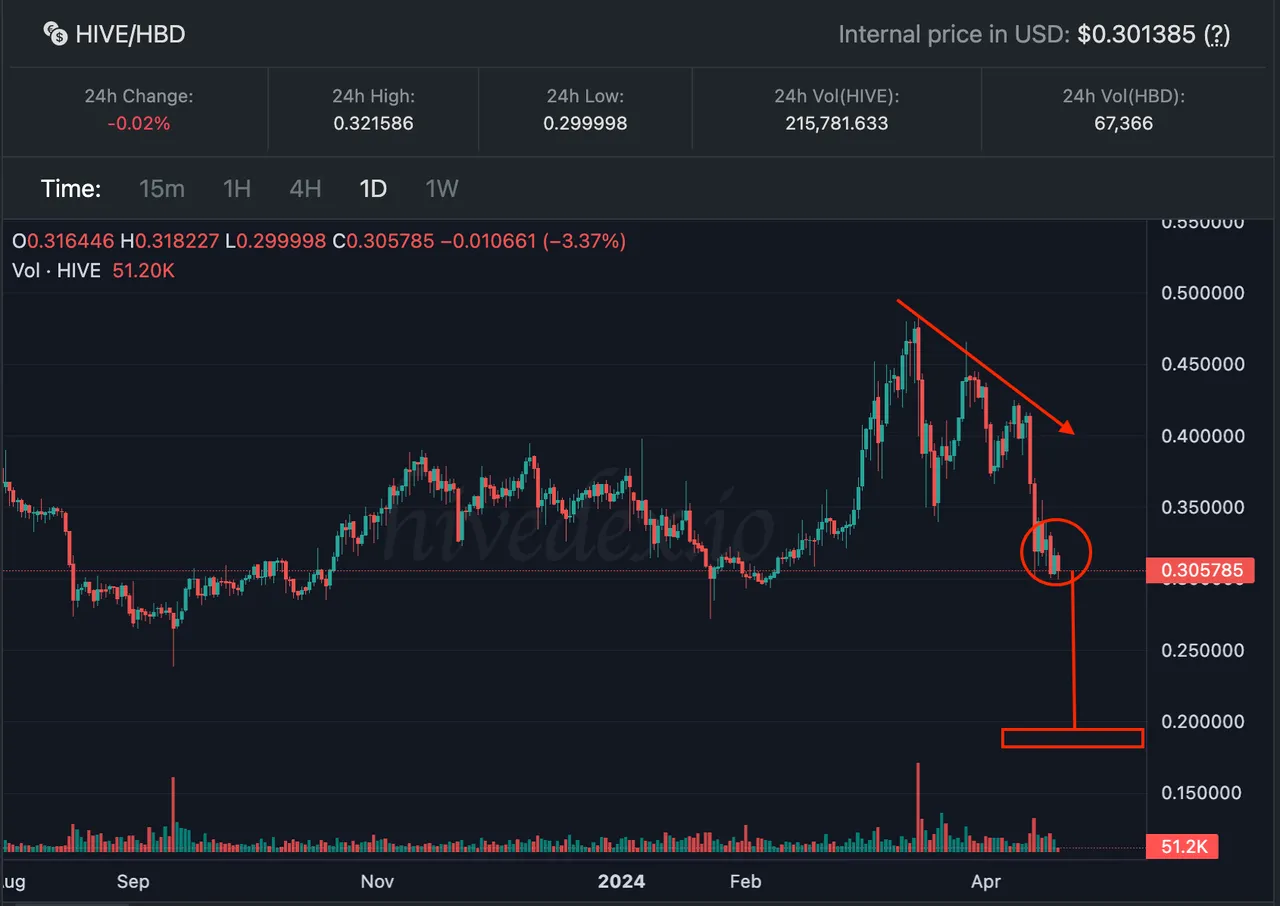
Things are looking pretty grim for HIVE. After stepping back to see the big picture on the daily charts, there is a very high probability that HIVE hits the .18 cent level next. All the patterns above suggest this, starting out with the large formation of the 3 descending peaks to the bearish flag circled in red, the next measured move would be the box in red.