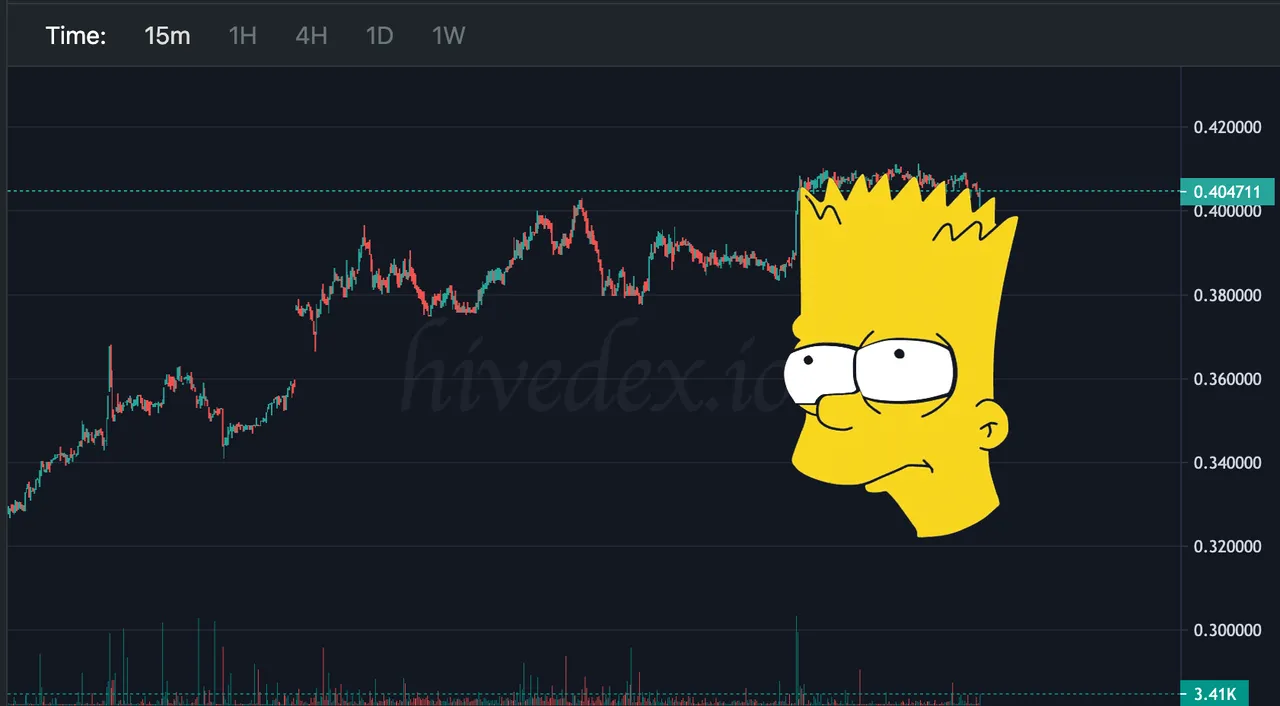
Nope, unfortunately my post yesterday about the Bull Flag being spotted on the charts seems to be invalidated by Time. As you can see, when a potential Bull Flag takes too much time to materialize the next move, which is usually equal to the length of the flagpole up to a higher target, then the pattern morphs into a bearish Bart Head. So yeah, according to this chart, we could now be seeing a big Bart move down as low as .32! lol