
SUMMARY
Omisego (OMG) might take the sideways price action option. Prior smaller wedge pattern allowed a near four month time exension; and likely the current pattern of an abcde triangle is being porcessed to consume even a longer serving of time. What's key is that the lower white line needs to hold as support. IF this support breaks, the downside targets can be deep low.
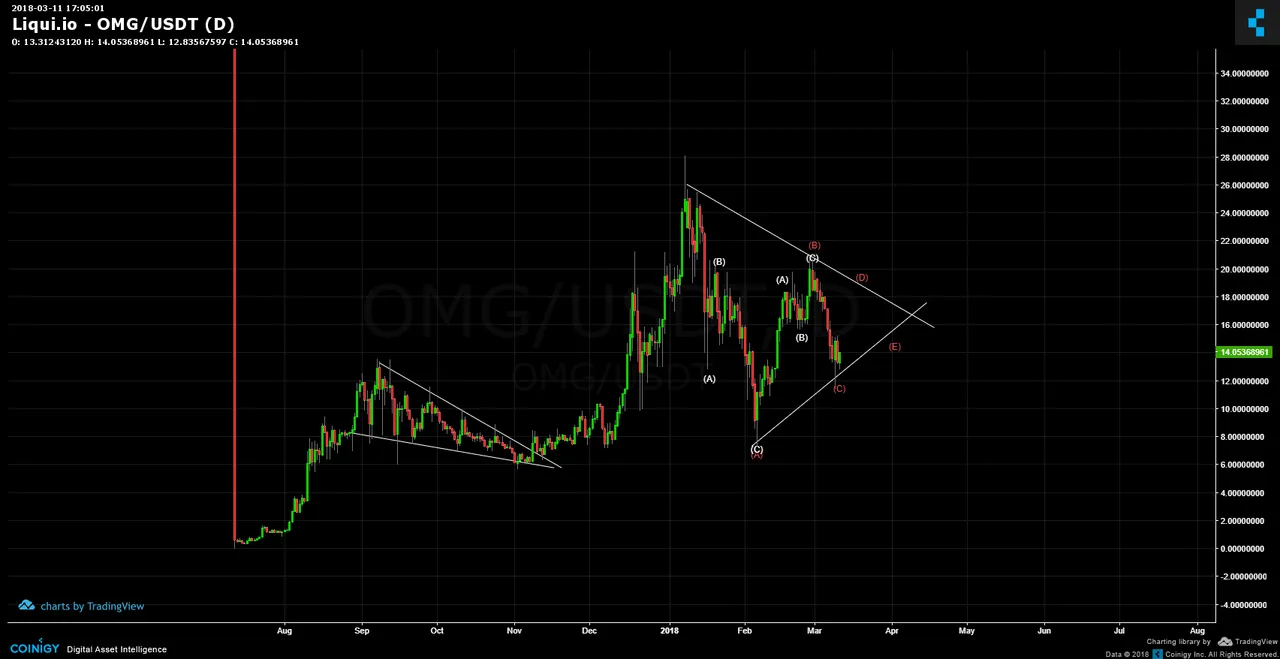
The closeup chart shows the projected pattern of the two remaining waves d,e. Each will be subdivided by an abc (white). The support line has held thus far but this correction could also morph into a more complex type but those scenarios won't be reviewed unless the triangle becomes invalidated.

Legal Disclaimer: I am not a financial advisor nor is any content in this article presented as financial advice. The information provided in this blog post and any other posts that I make and any accompanying material is for informational purposes only. It should not be considered financial or investment advice of any kind. One should consult with a financial or investment professional to determine what may be best for your individual needs. Plain English: This is only my opinion, make of it what you wish. What does this mean? It means it's not advice nor recommendation to either buy or sell anything! It's only meant for use as informative or entertainment purposes.
Please consider reviewing these Tutorials on:
Elliott Wave Counting Tutorial #1
Elliott Wave Counting Tutorial #2
Elliott Wave Counting Tutorial #3
Laddering and Buy/Sell Setups.
Laddering Example with EOS
Tutorial on the use of Fibonacci & Elliott Waves
@haejin's Trading Nuggets
Essay: Is Technical Analysis a Quantum Event?
Follow me on Twitter for Real Time Alerts!!
Follow me on StockTwits for UpDates!!
--
--

