Yesterday I started a three part series which talks about analysing and interpreting website traffic. I chose to analyse one of Nigeria’s major retailers named Jumia, using a website called Similarweb.com. The aim of my post was to help readers interpret the metrics that are provided on sites such as similarweb.com.
Here are a few of the insights I gained from yesterday’s analysis of Jumia’s website:
Jumia attracts 19% of all smartphone users in Nigeria
Jumia’s customers are almost as engaged as Amazon’s customers
Jumia’s second largest visitor base (78,000 visitors) is from the US and the fourth and fifth largest are Egypt and Niger respectively
Nigerians are looking to buy bicycles on Jumia
Jumia is most popular on Facebook.
Today, we will continue our analysis by comparing the operations of Jumia in relation to Konga. At the end of this analysis, we will have determined which of these online retailers are most dominant in the Nigerian e-commerce space and selected one of them as the better option for prospective business clients.
Jumia V Konga
I’ll start once again by typing the url for Jumia. Once the metrics for Jumia appear, click Compare and type the url for Konga.
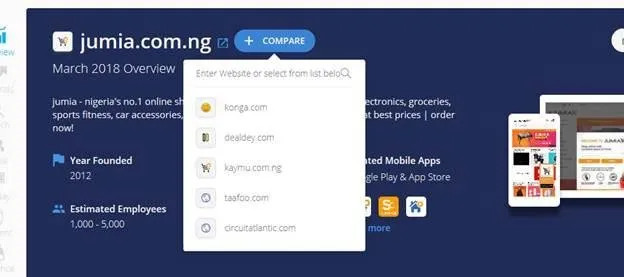
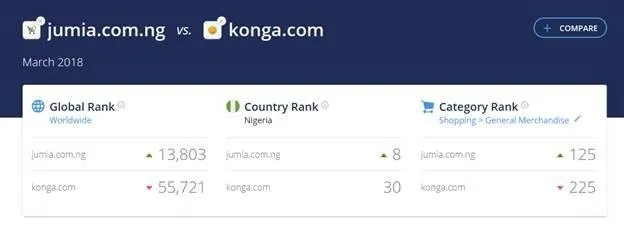
When you push enter you will be presented with the general rankings for both sites.
It looks to me like Jumia’s country ranking has increased by 2 spots since yesterday's post. They are now number 8. What is even more interesting is the fact that Konga is at number 30. Up until I analysed both websites, I was under the impression that Konga was more popular than Jumia. It turns out that I was very wrong.
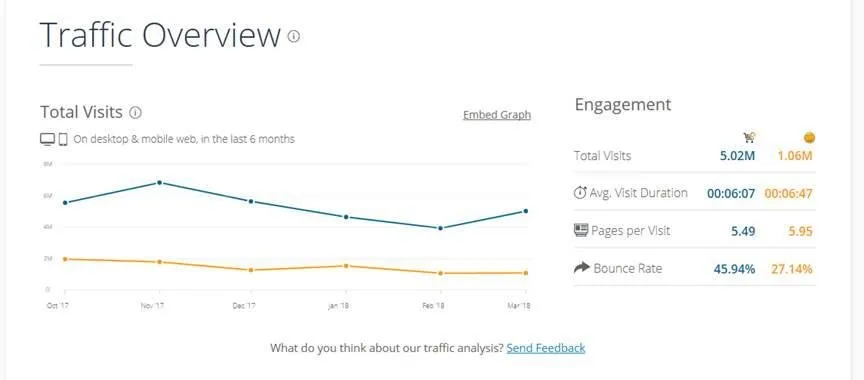
Looking at the traffic overview for both sites, it is clear that Jumia has over 5 times the number of visitors on Konga. Although it looks to me that the visitors on Konga are much more engaged than those on Jumia. This is evident from the average visit duration, which is .47 seconds higher on Konga than on Jumia. The page per visit is also higher on Konga, but what interests me most is the bounce rate. Konga’s website has half the bounce rate of Jumia’s website. This means that visitors are browsing through more pages on Konga before they leave.
But, what decisions can a business owner make using this metric? This metric tells me that although Jumia sees more traffic than Konga, a lot of the visitors may not make a purchase. All they seem to do is to leave the site after looking at one page. Konga’s visitors on other hand, look through multiple pages which indicates a higher tendency to make a purchase. Smart business executive will choose to place their items on Konga as opposed to Jumia.
In terms of traffic sources, I had already mentioned in my previous post that due to the fact that this metric only talks about data collected from visitors using desktop computers, I would be inclined not to attach so much weight to what the following data demonstrates. It would seem like Konga has more direct traffic when compared to Jumia.
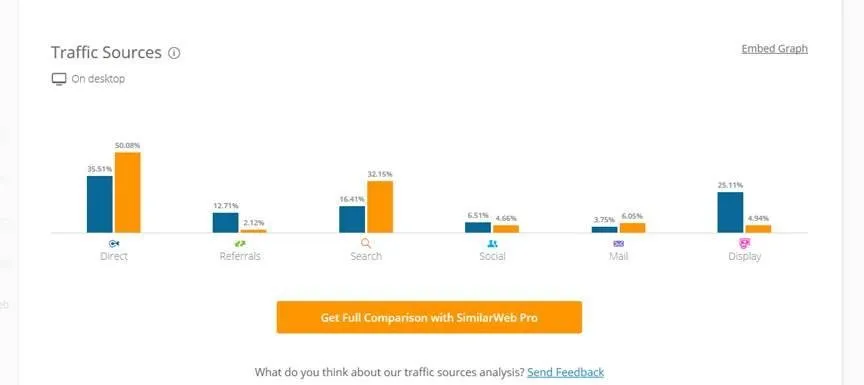
Unfortunately, this is the last metric similarweb.com provides free of charge. For more insights, you would need to go Pro. Notwithstanding this, I believe that we have drawn some important conclusions even with the little amount of data that was provided by this website.
In summary, even though Jumia ranks higher than Konga in Nigeria and attract more visitors, Konga is more successful at keeping their visitors engaged and potentially getting them to make a purchase.
For businesses looking to sell your product, Konga seems to be the better of both options.
Thanks for stopping by. Chat tomorrow.