
SUMMARY
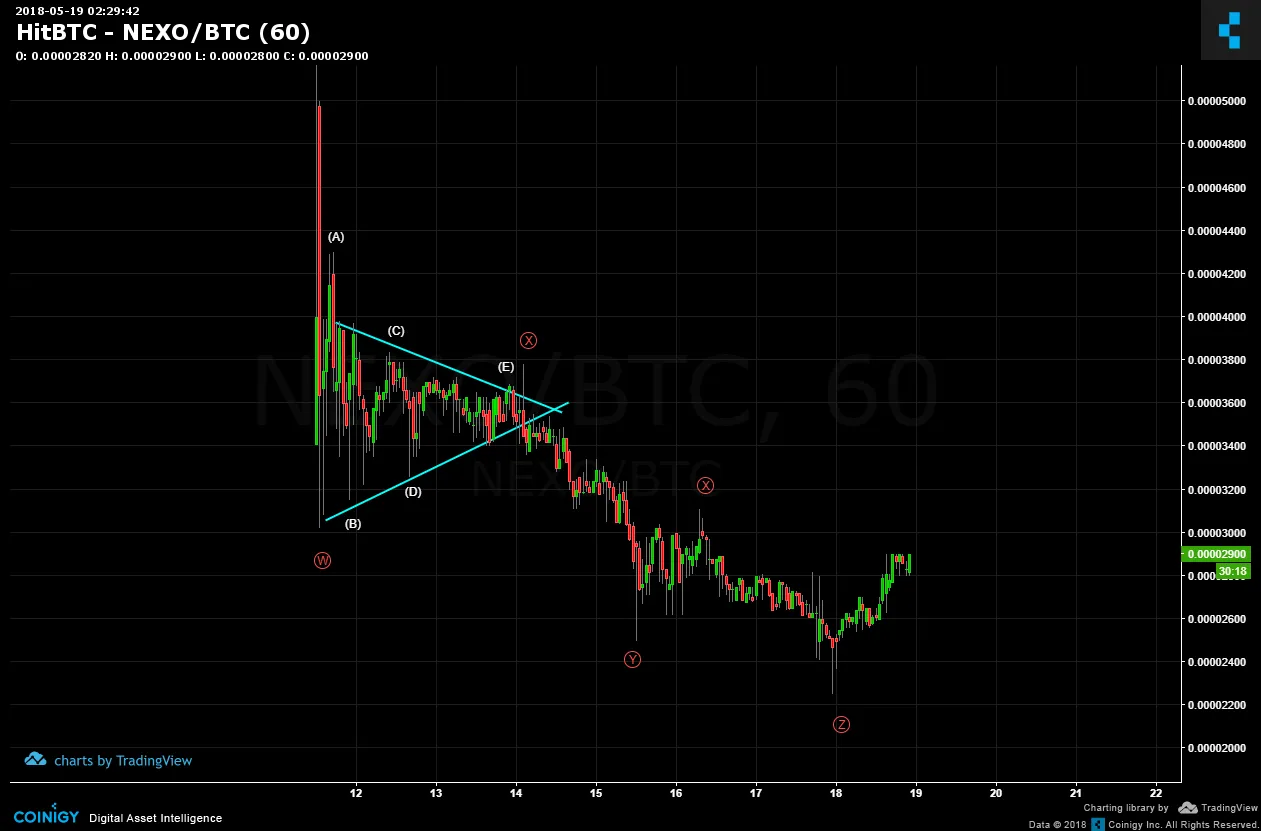
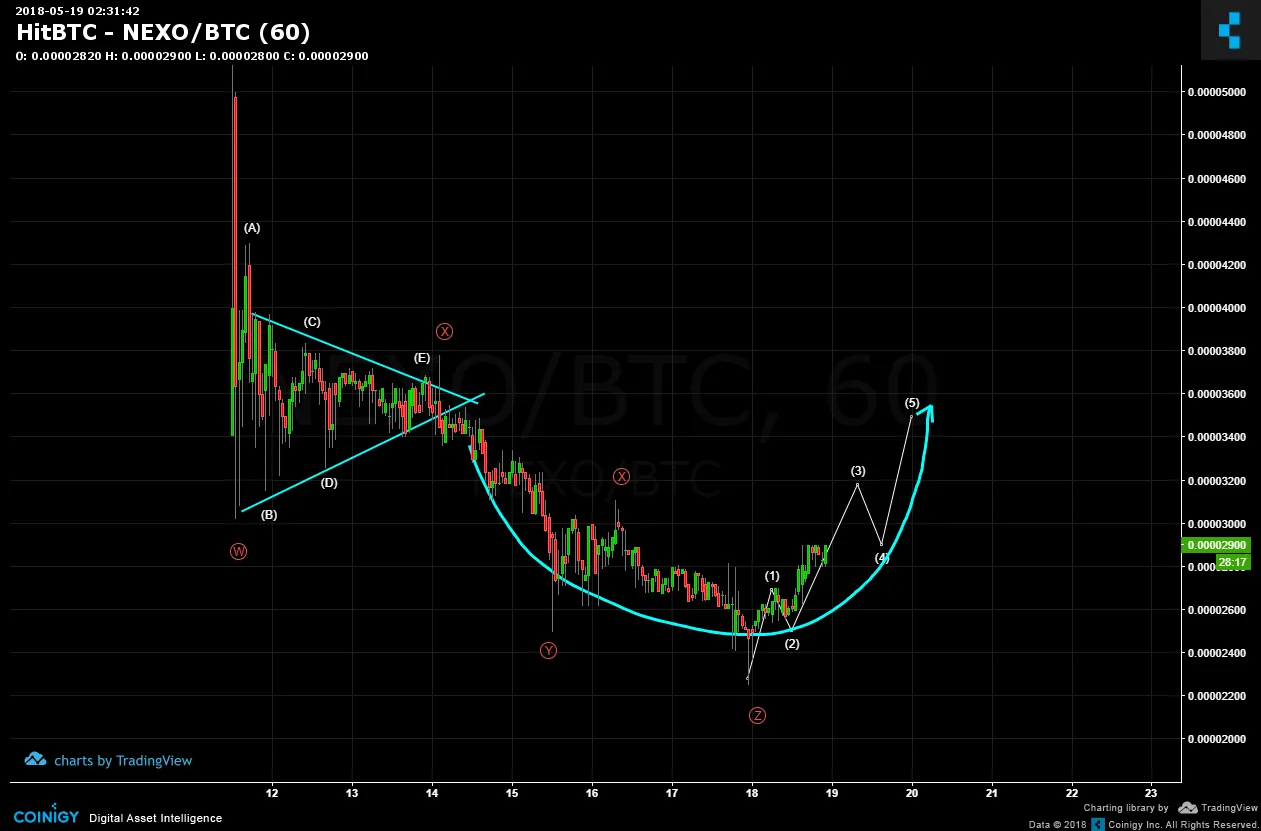
NEXO (NEXO/BTC) started its genesis as a correction as can be seen in the below chart. The WXYXZ (red) sequence shows to be complete. The first X wave patterned to be a symmetrical triangle. Note how the E wave of the triangle is at the top blue trendline. This usually has a propensity to decline and that's pretty much what happened. IF the final Z wave is complete, then a trend reversal could be in progress.
The reversal impulse is labeled in white. Thus far, waves 1 and 2 are complete and 3 is likely in progress. When including pattern, a rounded price formation seems to be taking place. Could this also morph into a Cup & Handle? I believe so.
Legal Disclaimer: I am not a financial advisor nor is any content in this article presented as financial advice. The information provided in this blog post and any other posts that I make and any accompanying material is for informational purposes only. It should not be considered financial or investment advice of any kind. One should consult with a financial or investment professional to determine what may be best for your individual needs. Plain English: This is only my opinion, make of it what you wish. What does this mean? It means it's not advice nor recommendation to either buy or sell anything! It's only meant for use as informative or entertainment purposes.
Please consider reviewing these Tutorials on:
Elliott Wave Counting Tutorial #1
Elliott Wave Counting Tutorial #2
Elliott Wave Counting Tutorial #3
Laddering and Buy/Sell Setups.
Laddering Example with EOS
Tutorial on the use of Fibonacci & Elliott Waves
@haejin's Trading Nuggets
Essay: Is Technical Analysis a Quantum Event?
Follow me on Twitter for Real Time Alerts!!
Follow me on StockTwits for UpDates!!
--
--

