
SUMMARY
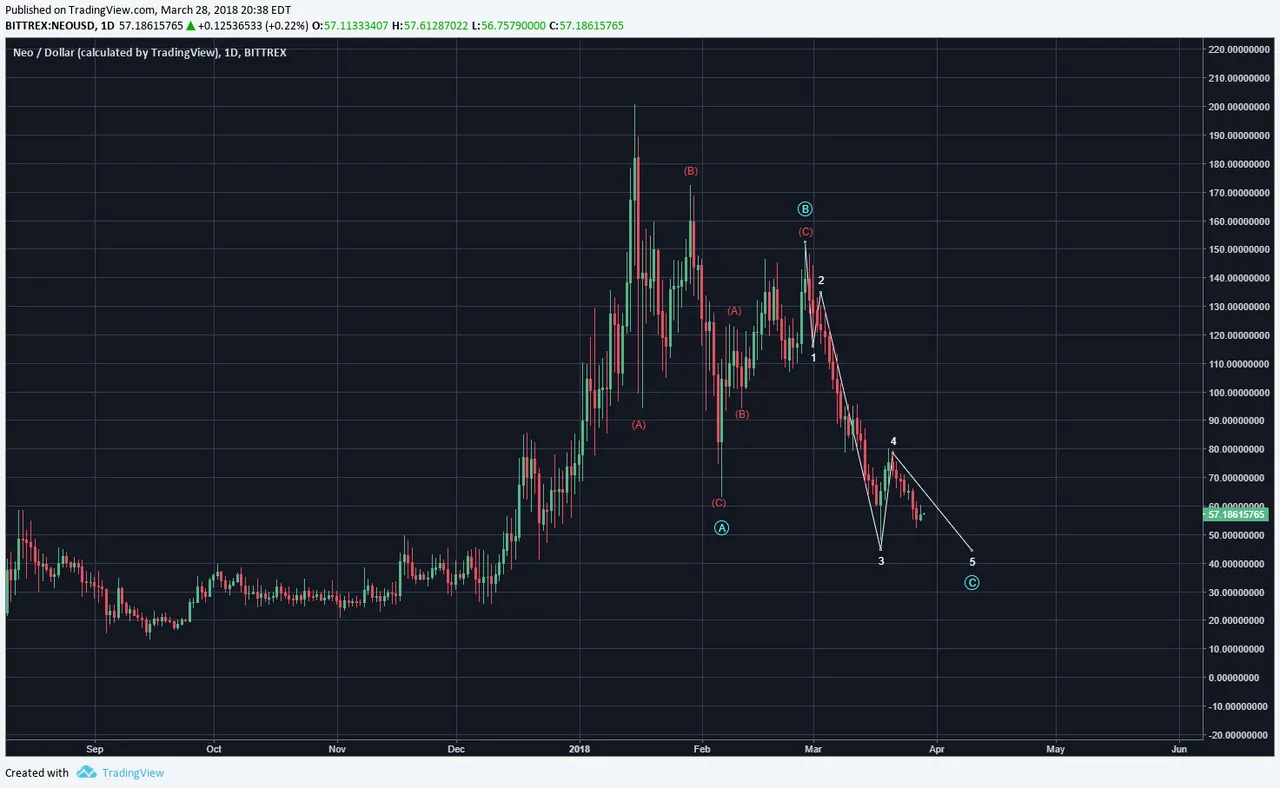
NEO price action has not shown any signs yet of a trend reversal. However, the correction can be counted in a couple different ways. The below chart shows an ABC with the subwaves of C almost in place with wave 5 currently in progress. Does this assure a correction bottom? Unfortunately, no; primarily because the tendency to sideways extend can't be underestimated.
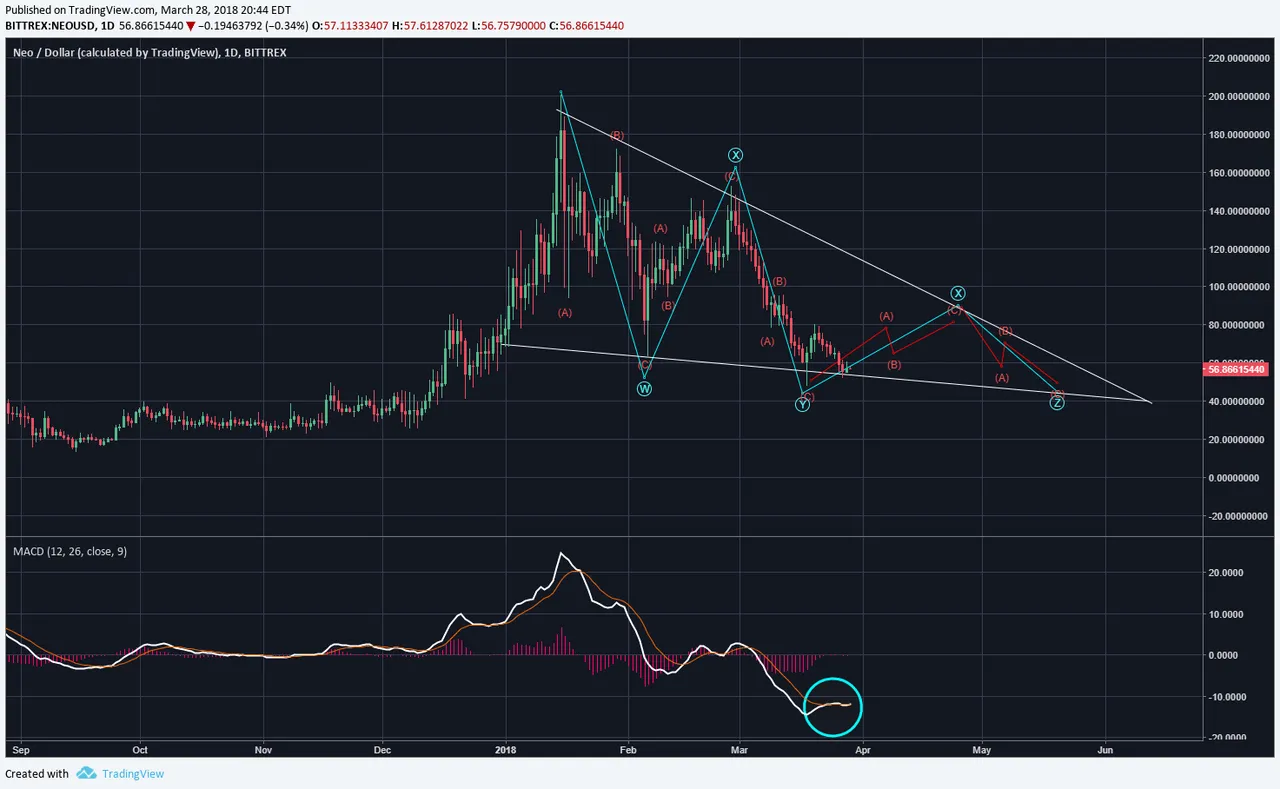
The second pattern is one that would allow a few more weeks of time and price extension. The ABCDE triangle fits well into allowing a good amount more of sideways action. The MACD is also looking oversold but likely to follow the up and down of the upcoming waves X and Z.
Legal Disclaimer: I am not a financial advisor nor is any content in this article presented as financial advice. The information provided in this blog post and any other posts that I make and any accompanying material is for informational purposes only. It should not be considered financial or investment advice of any kind. One should consult with a financial or investment professional to determine what may be best for your individual needs. Plain English: This is only my opinion, make of it what you wish. What does this mean? It means it's not advice nor recommendation to either buy or sell anything! It's only meant for use as informative or entertainment purposes.
Please consider reviewing these Tutorials on:
Elliott Wave Counting Tutorial #1
Elliott Wave Counting Tutorial #2
Elliott Wave Counting Tutorial #3
Laddering and Buy/Sell Setups.
Laddering Example with EOS
Tutorial on the use of Fibonacci & Elliott Waves
@haejin's Trading Nuggets
Essay: Is Technical Analysis a Quantum Event?
Follow me on Twitter for Real Time Alerts!!
Follow me on StockTwits for UpDates!!
--
--

