May 29, 2018
Here is 2 hour chart on VXX (iPath S&P 500 VIX ST Futures ETN).
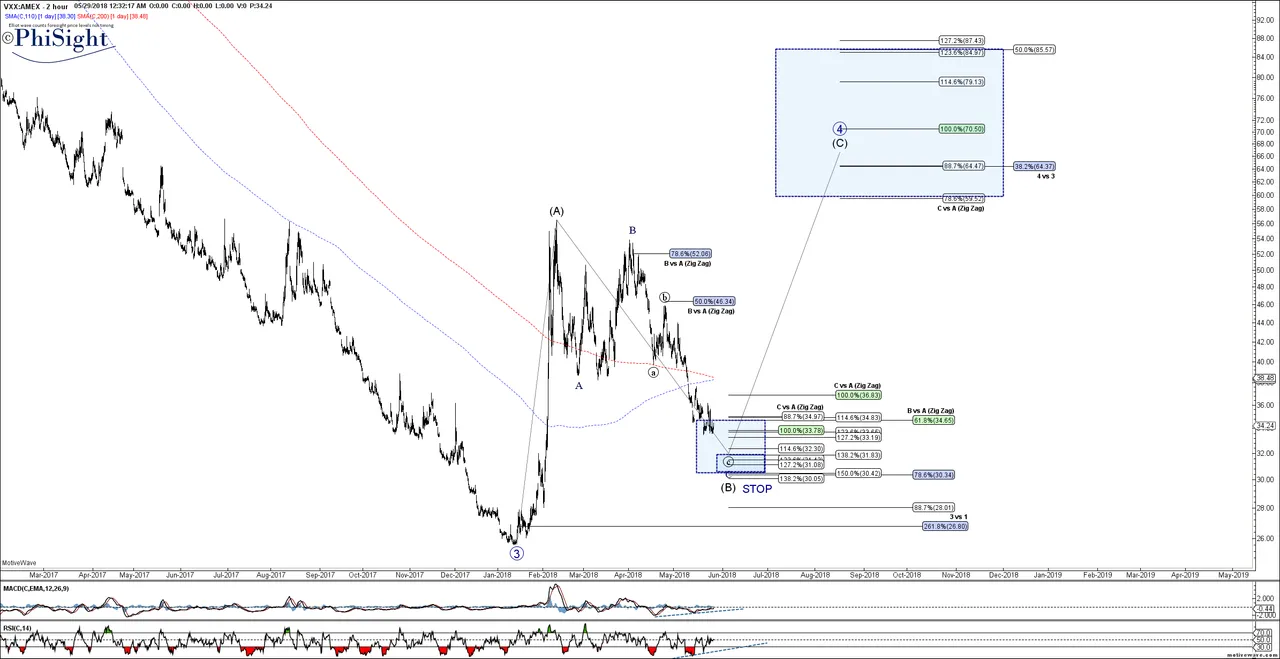
It is indicating that a turn down in the S&P 500, and an increase in volatility, is close at hand.
The VXX price should hit and turn from somewhere between 30-32 range and likely to spike to 60-70 range. STOP below 30 are highly advised to limit losses should one indulge in the pleasures of shorting a bull market!
Hope this analysis was/is/will be helpful!
Note: you can right-click and open charts in new tab to see them at full size -- they are quite large and clearer when expanded.