To my knowledge, bank loans are where money comes from. The bulk of the M1 supply, the things we spend every day, comes from bank loans (because we have a fractional reserve system).
The money you pay to your grocer was, almost always, created by a bank (via loan), not by the government.
In any case, regardless of what fraction of M1 is issued by the central bank instead of created by loaning out everything above the reserve-ratio, monies that are loaned out, deposited in a checking account, and spent count towards the velocity of money.
Even when we talk about dollar denominated deposits in foreign banks, other than a small amount of float, those end up invested/spent in the US. DeutcheBank does not take its dollar denominated deposits and stuff them into a mattress.
- It would be precise to say the M1, M2, and MZM count assets but not liabilities, so banks can expand their balance sheets by increasing both assets and offsetting liabilities in a way that increases M1, etc.
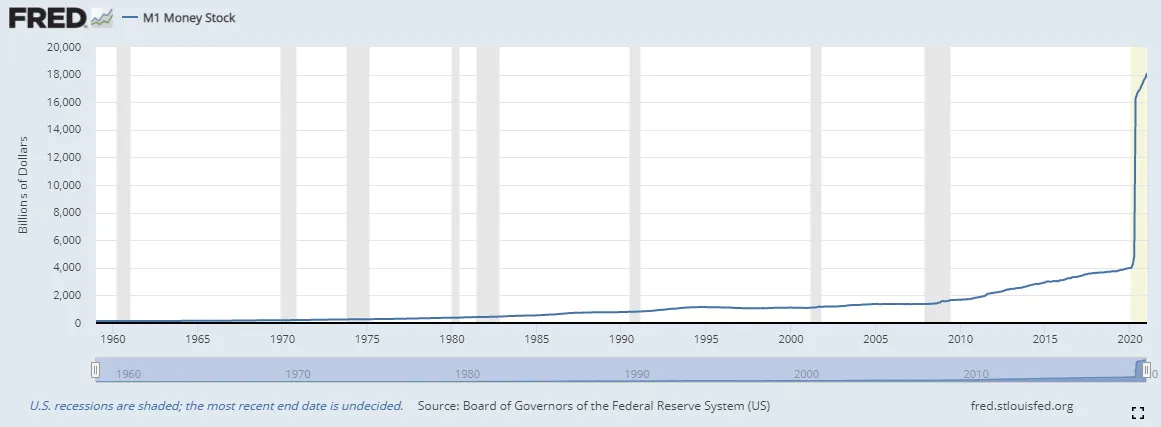
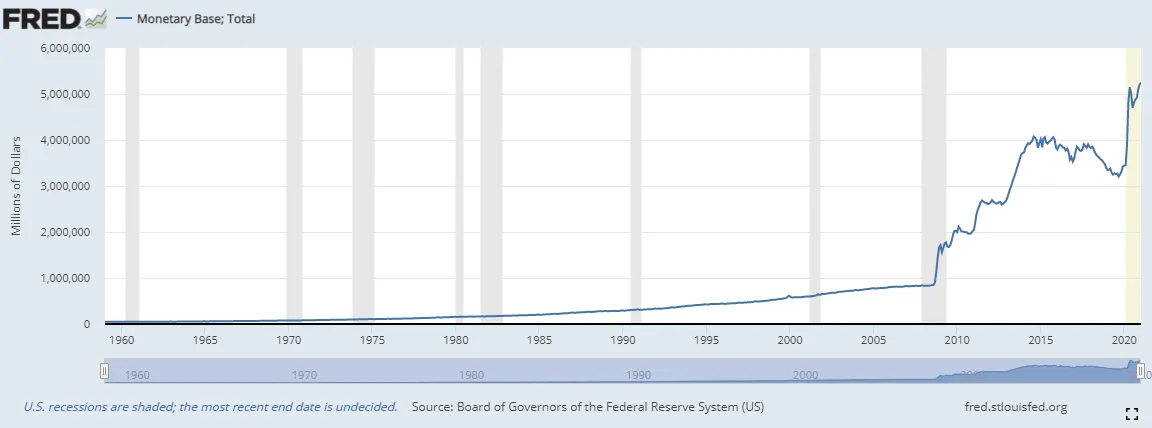
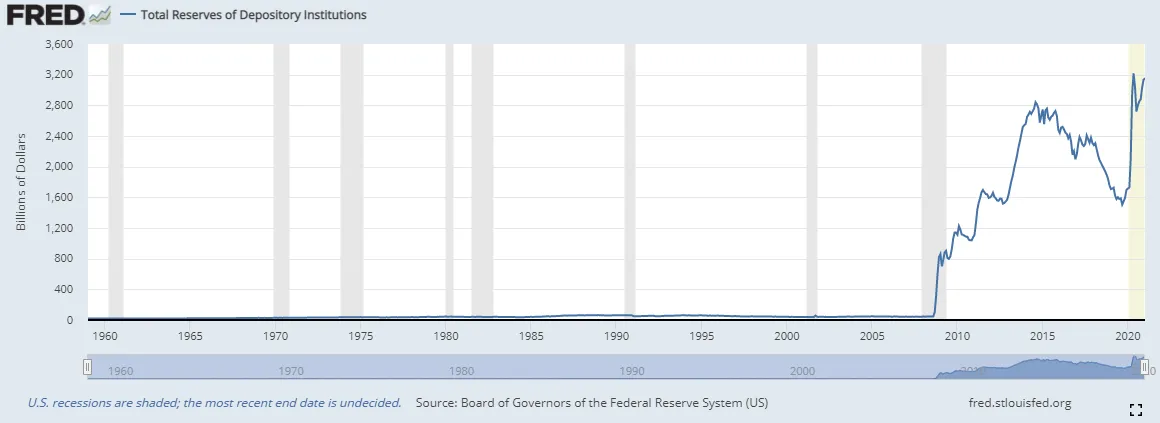
The best metric I know of for how much of M1 is "created" this way is simply subtracting the monetary base (the actual number of dollars issued by the Fed) from M1. Per FRED, M1SL (the variant of M1 currently being tracked) is $18.1 trillion as of January, and the Monetary Base is $5.25 trillion, so about $12.85 of M1SL comes from bank loan multiplier effects. - Banks traditionally loaned out all of their money down to the required reserve ratio. This used (more-or-less) to be the case (banks would often hold "excess reserves" above the reserve requirement, but these would be relatively small), but this changed after the 2008 financial crisis when the Fed started paying interest on bank reserves kept on deposit with the Fed. Reserves are currently around $3.15 trillion, or about 25% of the gap between M1 and the Monetary Base. It looks like required reserves are 3-10% currently.

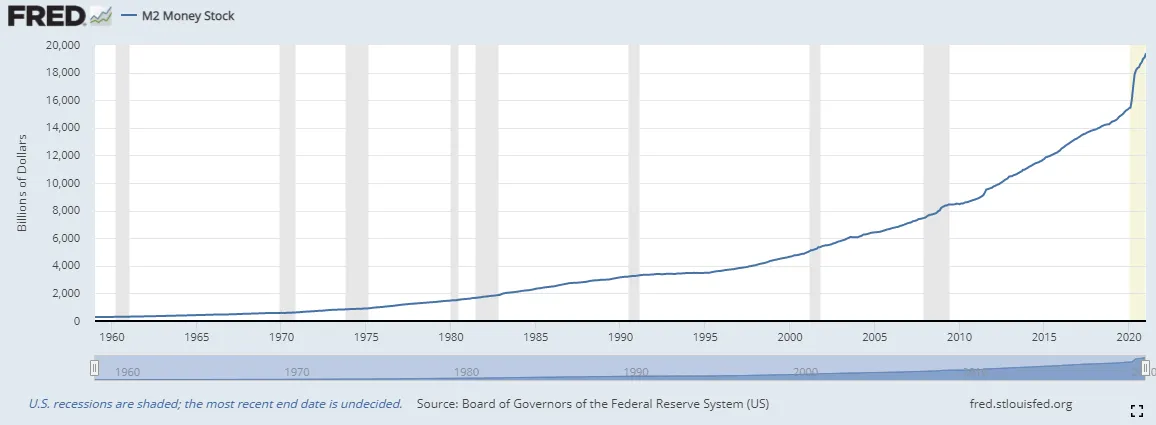
It also looks like M2 has grown by much less than M1. A year ago, M1 was $4T and M2 was $15.4T, compared to $18.1T and $19.4T respectively in January. So the gap between the two fell from $11.4T to $1.3T.
The graphs suggest that M1 has gone from $4T to $15.4T in a year
IIRC it roughly tripled during the response to the financial crisis, as well. There were cries of "Zimbabwe!" and fears of runaway inflation, but not a blip because aggregate demand was so far short of potential production.
I’m a little concerned about what happens when aggregate demand increases.
Meantime, the bulk of the aggregate price increase in equities and crypto is obviously inflation.