What is a Bollinger Band?
A Bollinger Band, developed by famous technical trader John Bollinger, is plotted two standard deviations away from a simple moving average. (https://www.investopedia.com/terms/b/bollingerbands.asp)
A Bollinger Band is a lagging indicator. A lagging indicator is one that follows price movements and has less predictive qualities. (https://www.investopedia.com/university/indicator_oscillator/ind_osc1.asp)
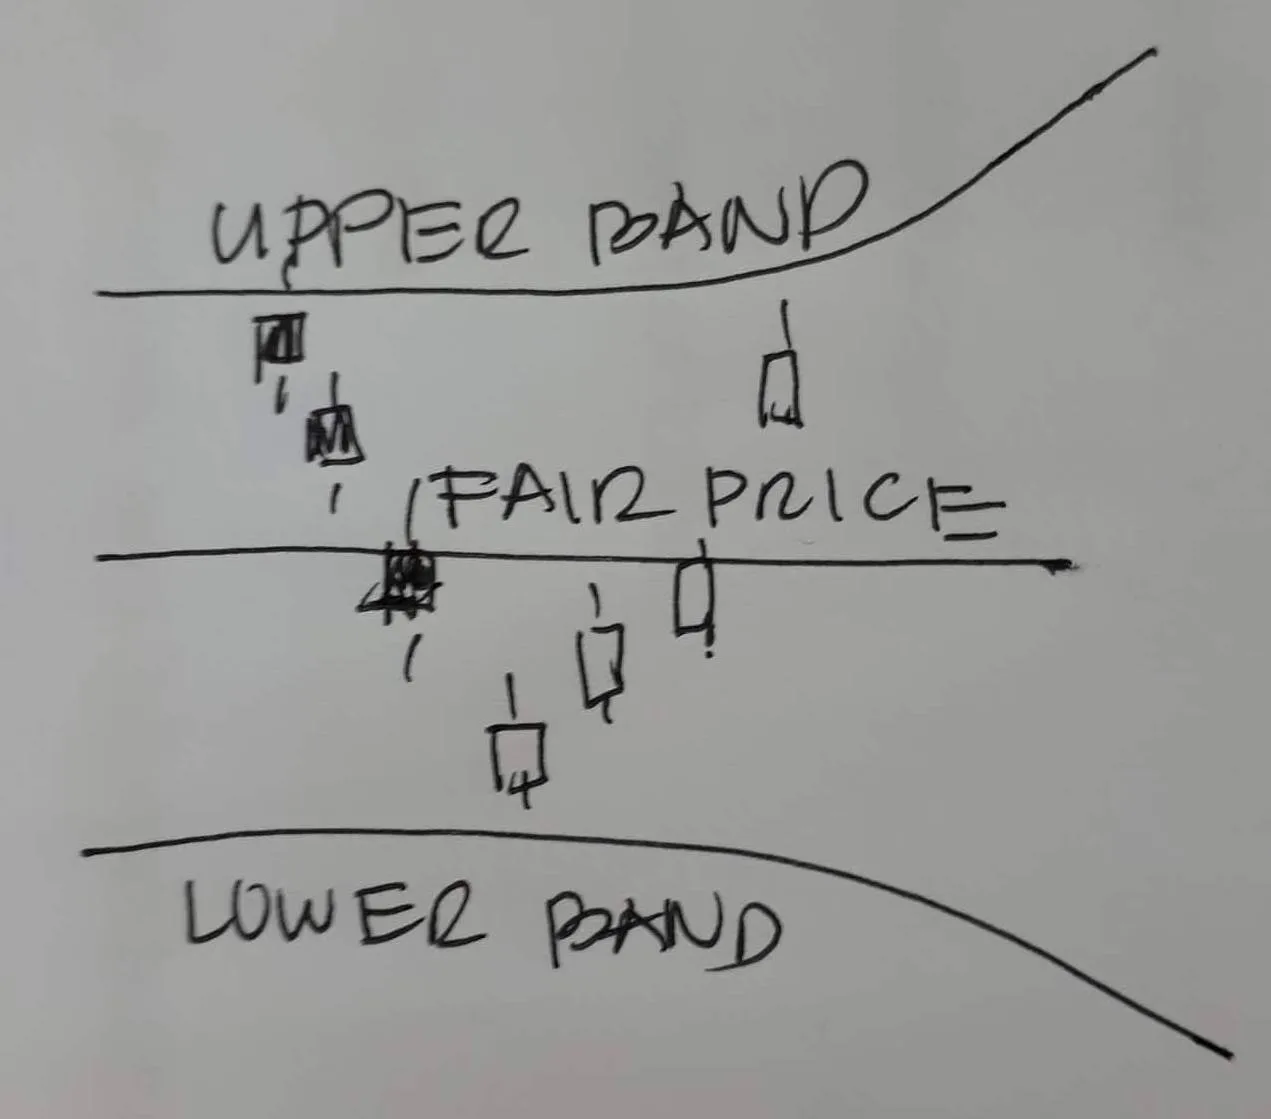
How do I BUY & SELL using BB? First we talk about candlestick and BB rabbit in trading. Candlestick: the white one is BULL candle meaning price is expected to go up and the black one is a BEAR candle, price is expected to go down.
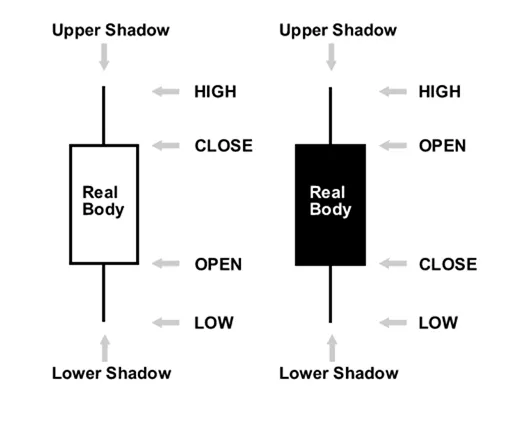
candlestick
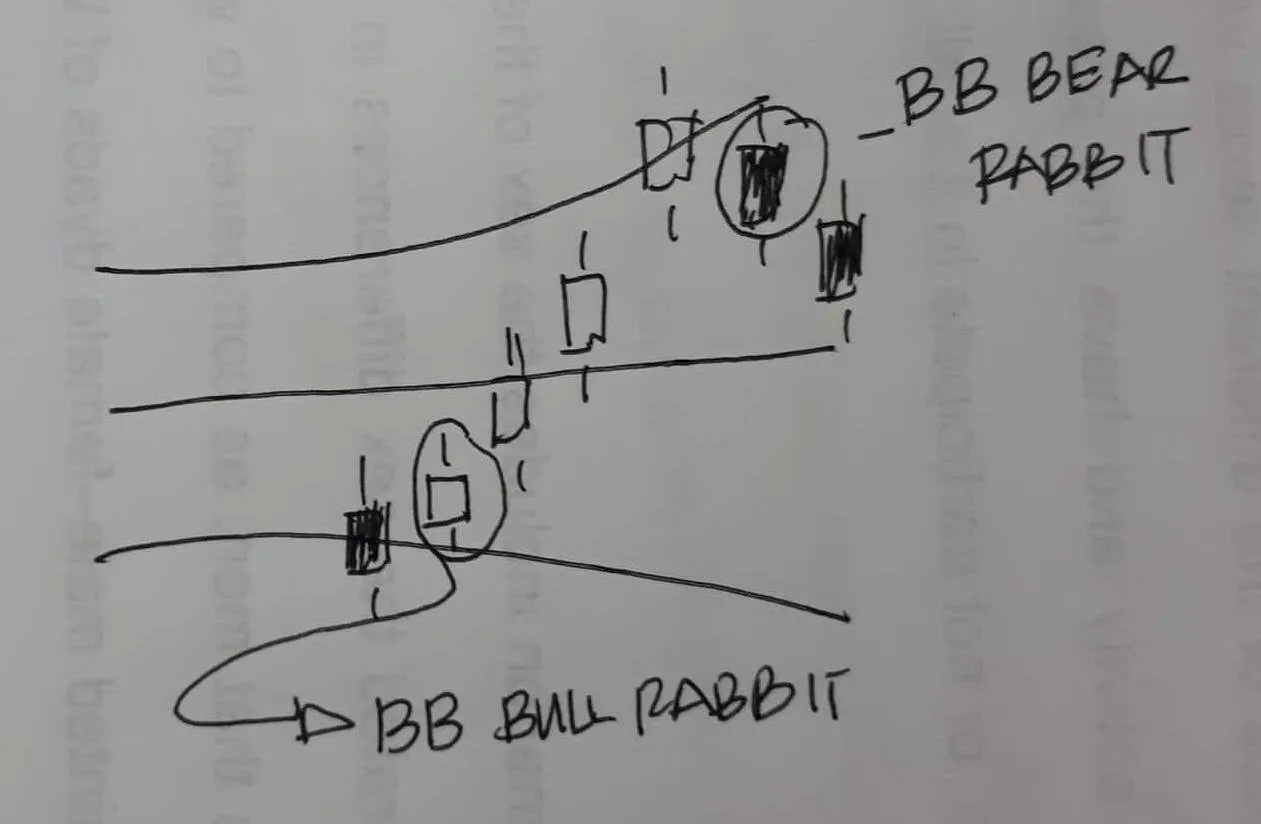
The Bollinger Band Rabbit (BB Rabbit): BB Rabbit could be bullish or bearish Rabbit.
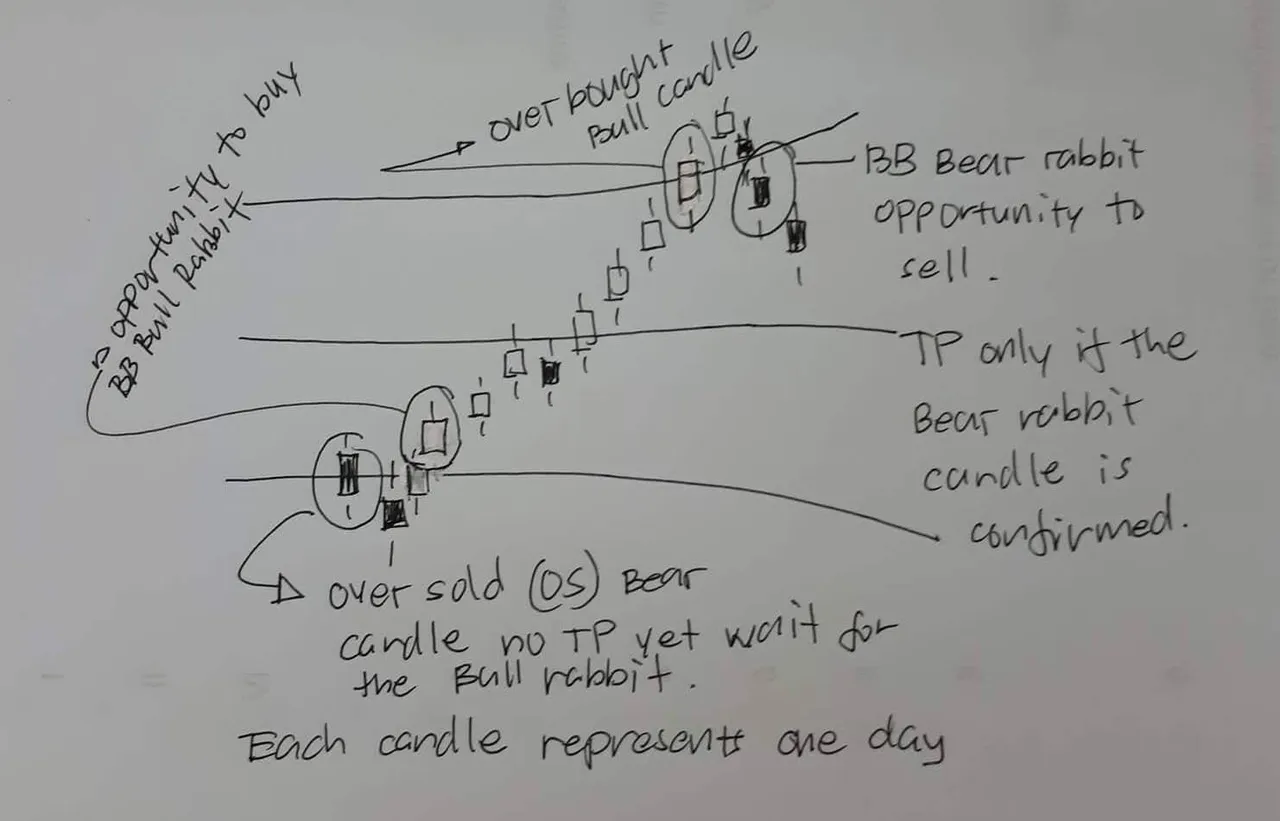
For the BUY/SELL/Take Profit (TP)
Next Elementary class. I'll be talking about the combination of BB and Ichimoku (IM).
Point of View: