
SUMMARY
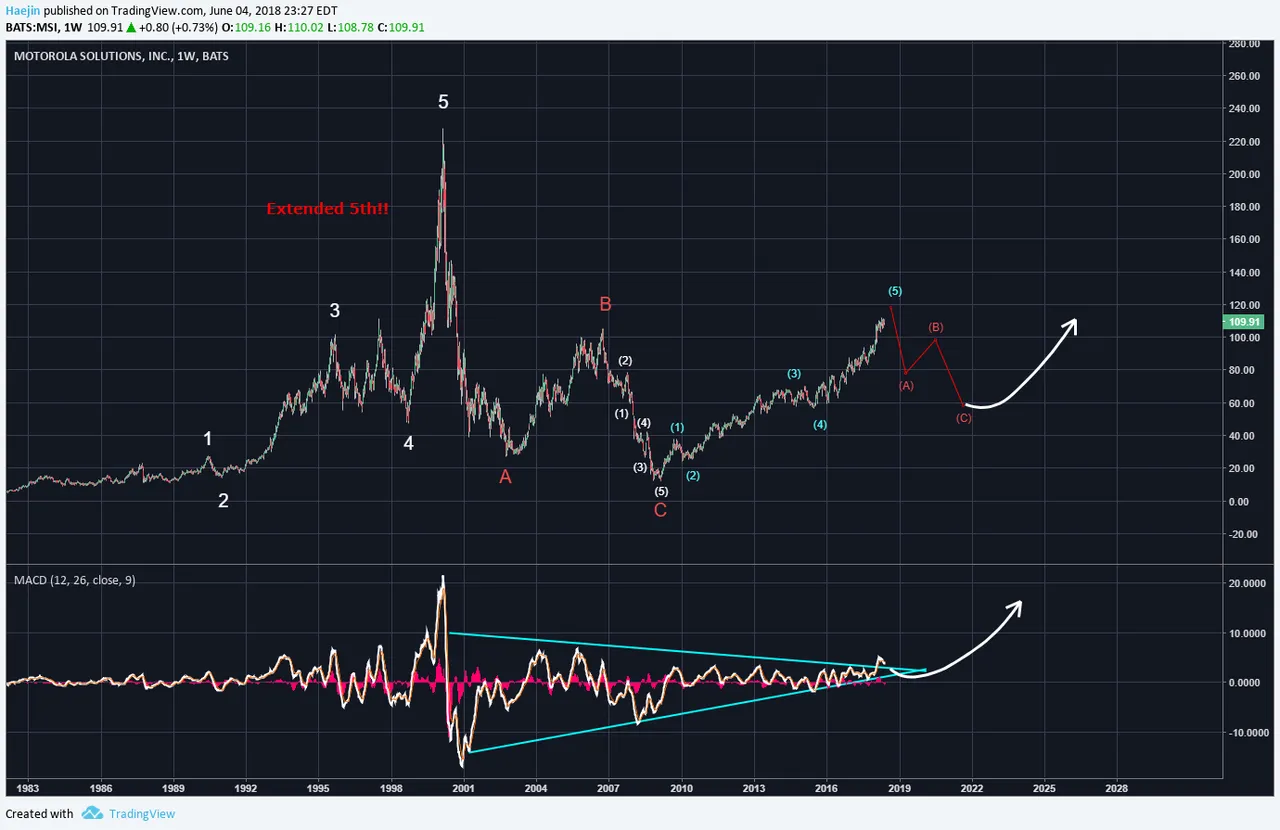
What is the most obvious feature in this weekly chart of Motorol Solutions Inc. (MSI)? What is sticking up the most? If you view the impulse (white waves); you should be able to notice the extended 5th wave. What do you do when there is an extended 5th? You take your profits and don't walk but run! The ABC correction that followed nearly decimated MSI. The red C wave retraced to the prior wave 2 level and that's almost always around 0.934 Fib level.

However, the best time to buy is at the terminal ends of a correction. So while everyone was freaking out in fear at the C wave terminal end; Technical Analysts would have been buying! Since then, price has impulsed up in five waves as labeled by the blue. So, if the blue 5th is complete, there must follow a correction (red ABC). The white arrow points to some amazing price rise potential which MACD should correlate with.
Legal Disclaimer: I am not a financial advisor nor is any content in this article presented as financial advice. The information provided in this blog post and any other posts that I make and any accompanying material is for informational purposes only. It should not be considered financial or investment advice of any kind. One should consult with a financial or investment professional to determine what may be best for your individual needs. Plain English: This is only my opinion, make of it what you wish. What does this mean? It means it's not advice nor recommendation to either buy or sell anything! It's only meant for use as informative or entertainment purposes.
--

