
SUMMARY
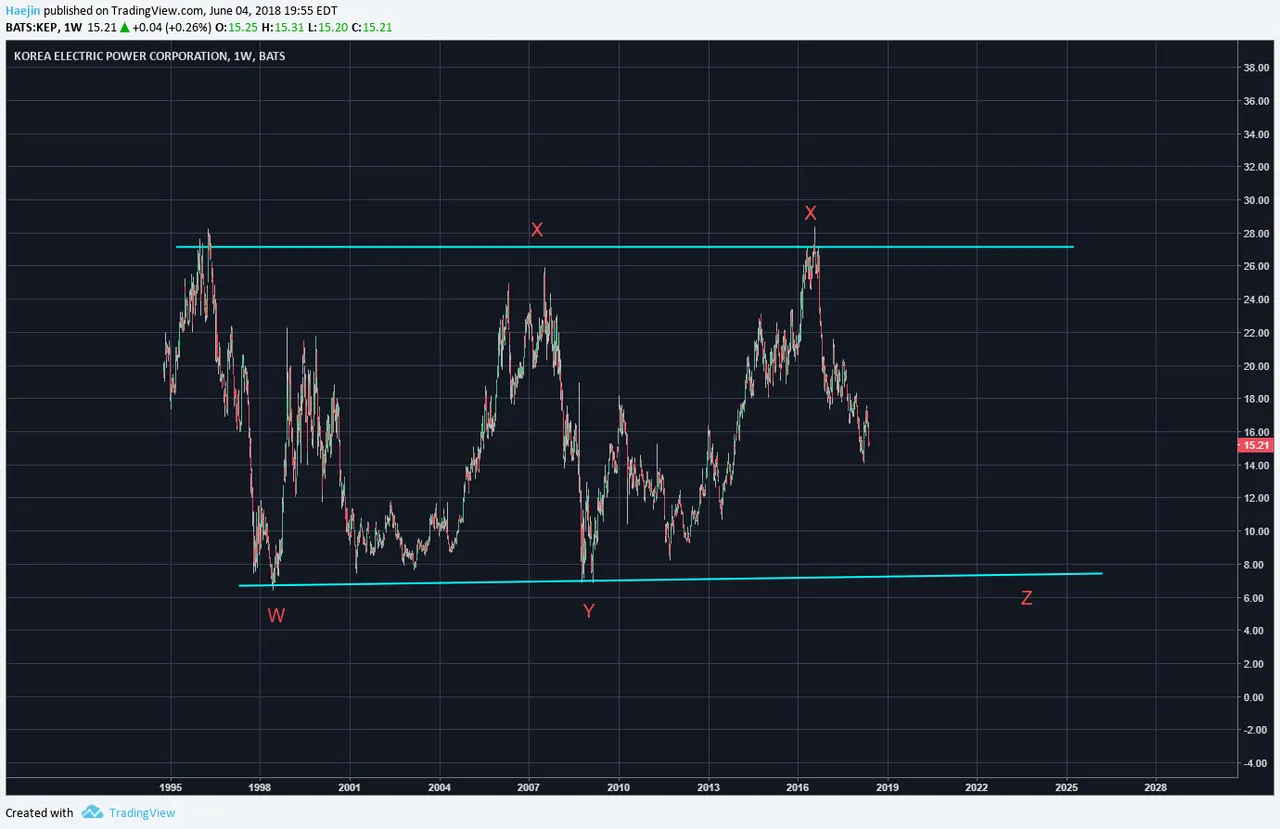
When price moves sides, it invariably becomes a combination. The below chart of Korea Electric Power Corp. (KEP) shows that price has been moving in a sideways action for over 23 years! That is a major time frame of patterning out the WXYXZ sequence. This is why I often use the weekly charts because it provides a wide scoped big picture perspective. In fact, anyone who bought at the IPO would be at a loss right now. What price direction might be next?
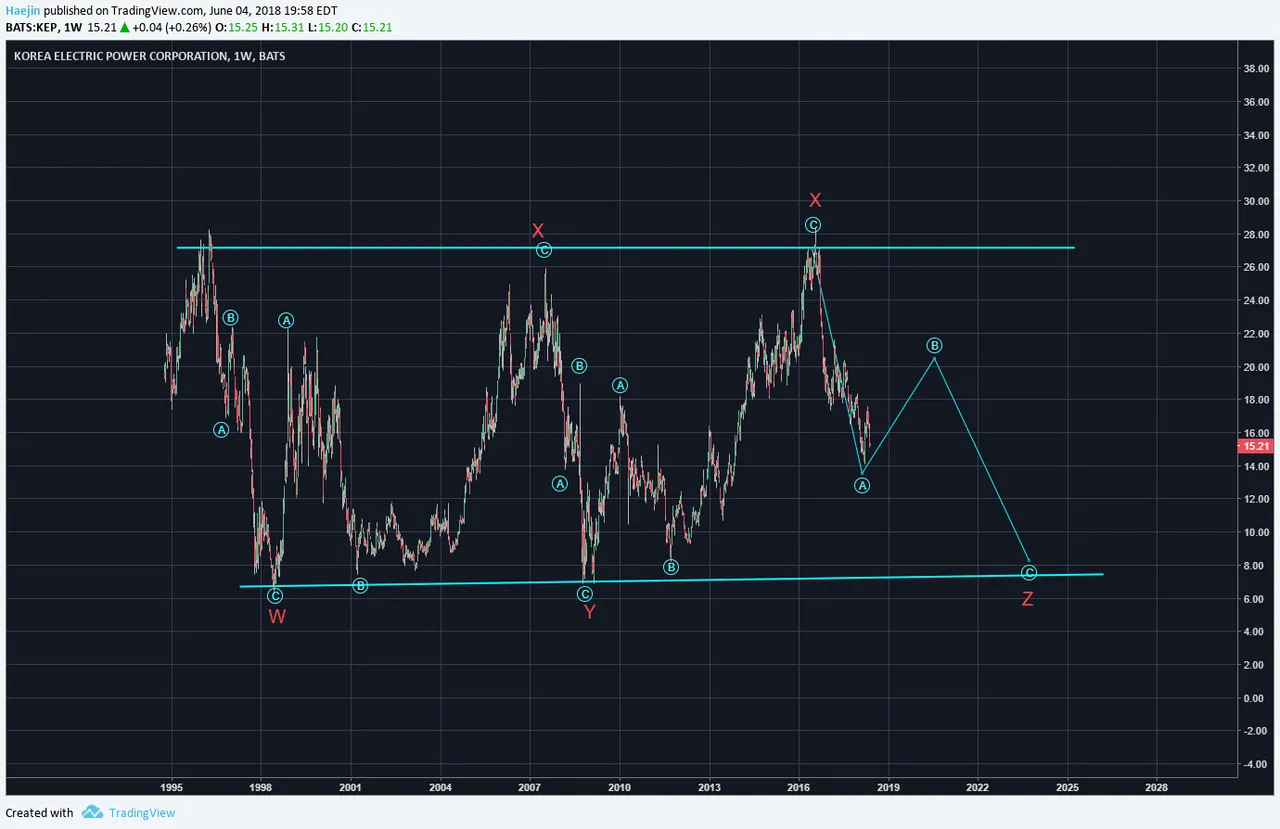
The subwaves of each WXYXZ wave have been included in color blue. WXYX have been completed and the Z wave is about 1/3 complete. The blue A wave of the red Z has placed five subwaves down and blue B should give a multi year sizable bounce. So, is not a good time to be buying or selling? The final blue c wave should complete the red Z.
Legal Disclaimer: I am not a financial advisor nor is any content in this article presented as financial advice. The information provided in this blog post and any other posts that I make and any accompanying material is for informational purposes only. It should not be considered financial or investment advice of any kind. One should consult with a financial or investment professional to determine what may be best for your individual needs. Plain English: This is only my opinion, make of it what you wish. What does this mean? It means it's not advice nor recommendation to either buy or sell anything! It's only meant for use as informative or entertainment purposes.
--

