
SUMMARY
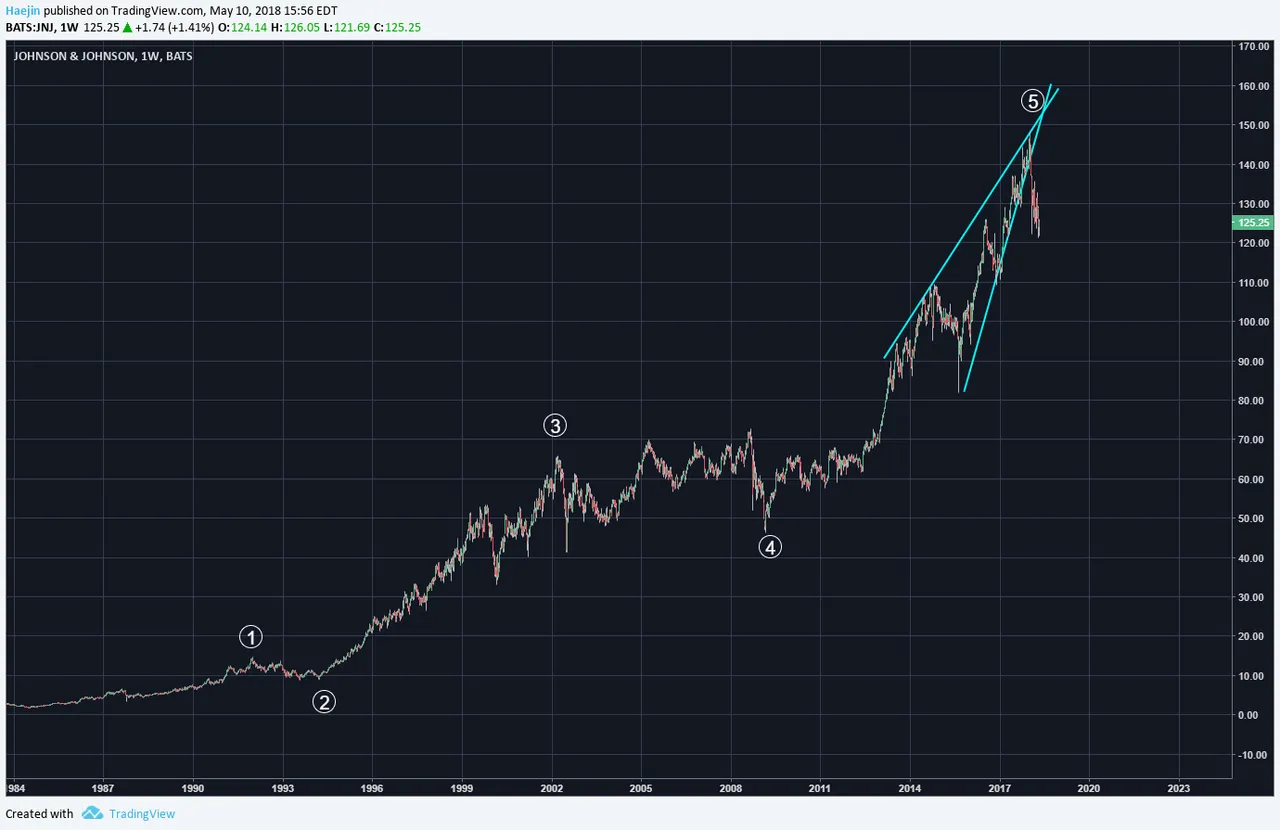
Here is a very long term chart for Johnson & Johnson (JNJ), a behemoth of a company. I've posted the Elliott Waves and it seems that all five waves are complete. In fact, the blue lines pattern out an ending diagonal. There is a reason why it's called an "ending". Price has already decisively breached through the lower blue trend line and that is NOT a good sign.
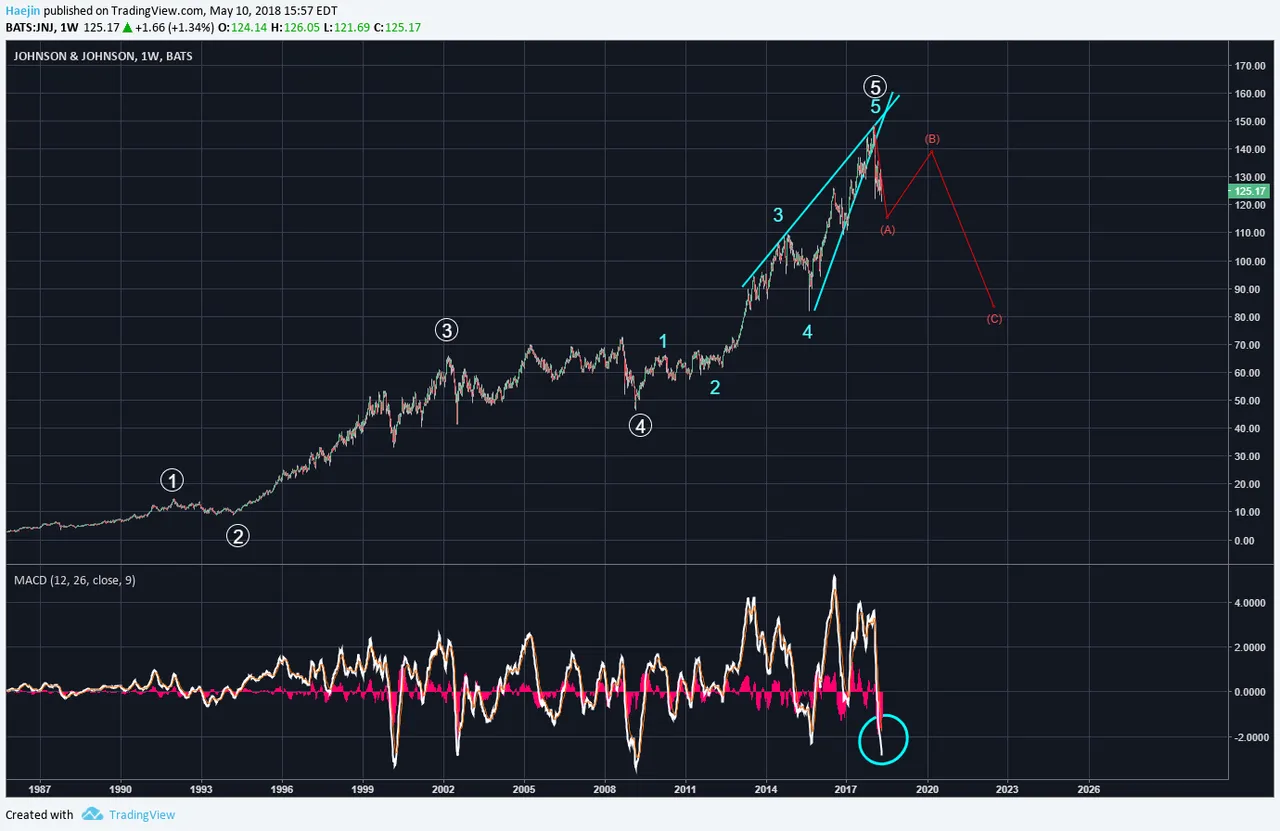
Since the MACD is a bit oversold, the B wave bounce is due as shown in the chart below. However, the C wave down is currently pegged the blue wave 4 but there is a scenario for the white wave 4 as well. Be cautious!
Legal Disclaimer: I am not a financial advisor nor is any content in this article presented as financial advice. The information provided in this blog post and any other posts that I make and any accompanying material is for informational purposes only. It should not be considered financial or investment advice of any kind. One should consult with a financial or investment professional to determine what may be best for your individual needs. Plain English: This is only my opinion, make of it what you wish. What does this mean? It means it's not advice nor recommendation to either buy or sell anything! It's only meant for use as informative or entertainment purposes.
Please consider reviewing these Tutorials on:
Elliott Wave Counting Tutorial #1
Elliott Wave Counting Tutorial #2
Elliott Wave Counting Tutorial #3
Laddering and Buy/Sell Setups.
Laddering Example with EOS
Tutorial on the use of Fibonacci & Elliott Waves
@haejin's Trading Nuggets
Essay: Is Technical Analysis a Quantum Event?
Follow me on Twitter for Real Time Alerts!!
Follow me on StockTwits for UpDates!!
--
--

