
SUMMARY
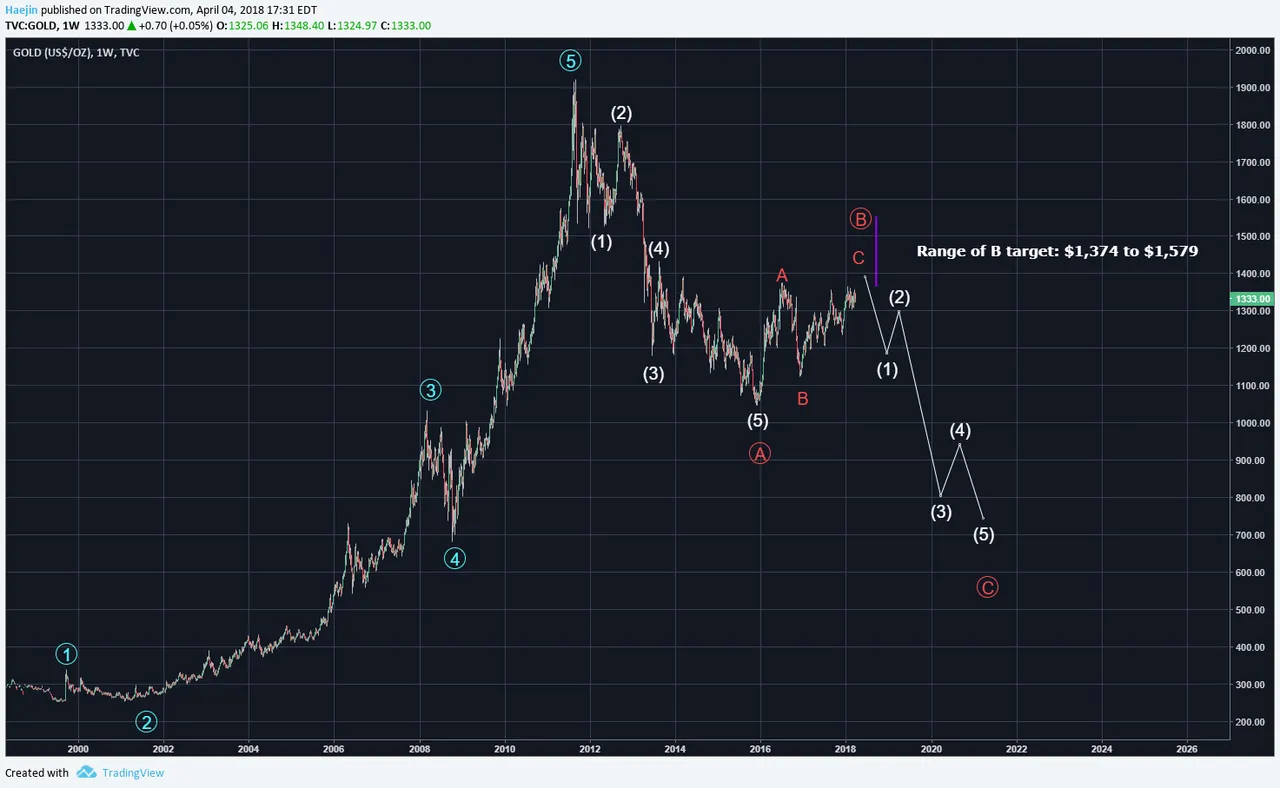
Gold is likely still in a long term bear market. The chart below shows the update wave counts as a massive ZigZag count of 5,3,5 on the ABC waves. This is a weekly chart and so far, the Elliott Waves are quite crisp and clear. The B wave is still in progress and will likely be so until March of 2019 where the ranges of $1,374 to $1,570 can be potential.
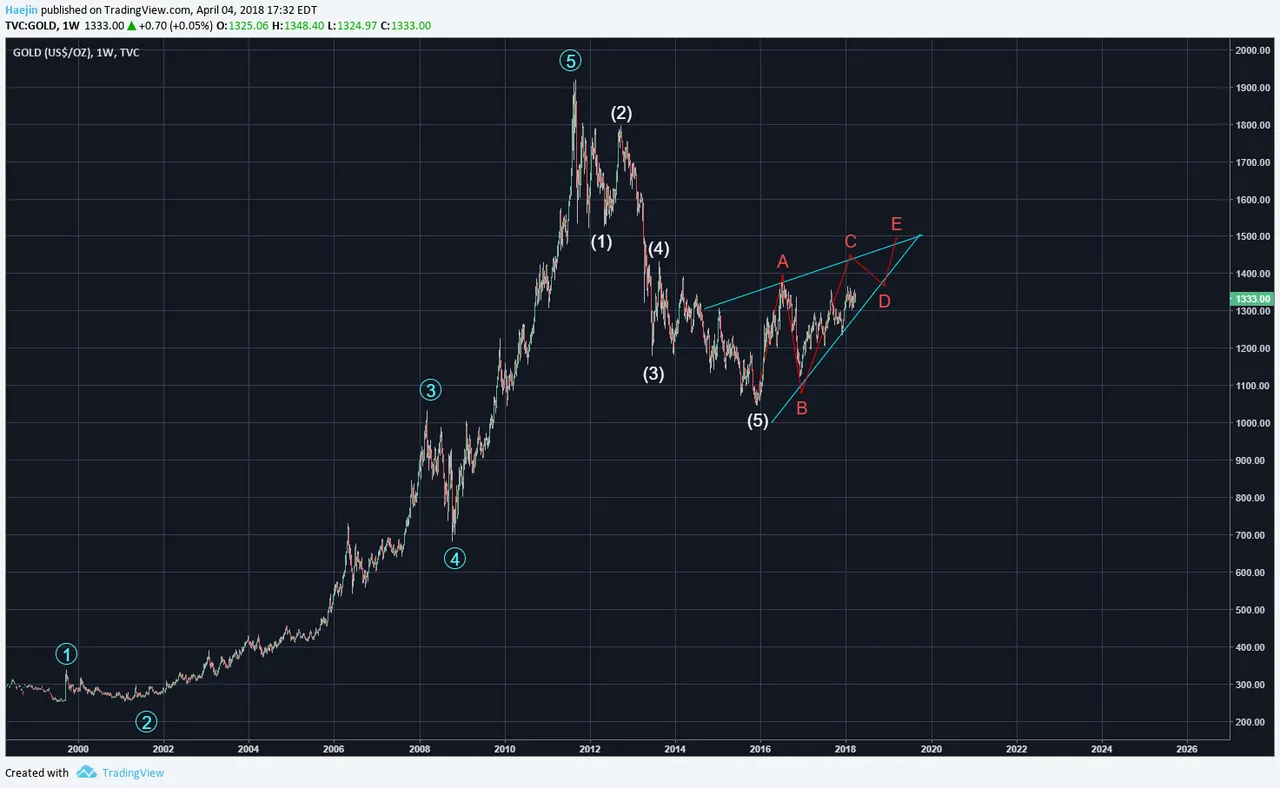
Here is the same chart but with the upward pointing wedge pattern in place (blue lines). The A and B waves are complete and C is in progress. That would D and E to compelte the pattern and bring price to a close proximity to the apex. Again, this is a weekly chart and so most of 2018 will likely be spent in compeleting this bearish wedge.
Legal Disclaimer: I am not a financial advisor nor is any content in this article presented as financial advice. The information provided in this blog post and any other posts that I make and any accompanying material is for informational purposes only. It should not be considered financial or investment advice of any kind. One should consult with a financial or investment professional to determine what may be best for your individual needs. Plain English: This is only my opinion, make of it what you wish. What does this mean? It means it's not advice nor recommendation to either buy or sell anything! It's only meant for use as informative or entertainment purposes.
Please consider reviewing these Tutorials on:
Elliott Wave Counting Tutorial #1
Elliott Wave Counting Tutorial #2
Elliott Wave Counting Tutorial #3
Laddering and Buy/Sell Setups.
Laddering Example with EOS
Tutorial on the use of Fibonacci & Elliott Waves
@haejin's Trading Nuggets
Essay: Is Technical Analysis a Quantum Event?
Follow me on Twitter for Real Time Alerts!!
Follow me on StockTwits for UpDates!!
--
--

