
SUMMARY
Note: For anyone who missed the BitcoinLive Information Webinar, here is the replay link: 
As of June 4, ALL Crypto Analysis will be posted on the BitcoinLive channel and Steemit will be dedicated for Equity, Commodity and Options Analysis. To Signup for the BitcoinLive limited Founding Membership slots, use this link: https://get.bitcoin.live/haejin/
__
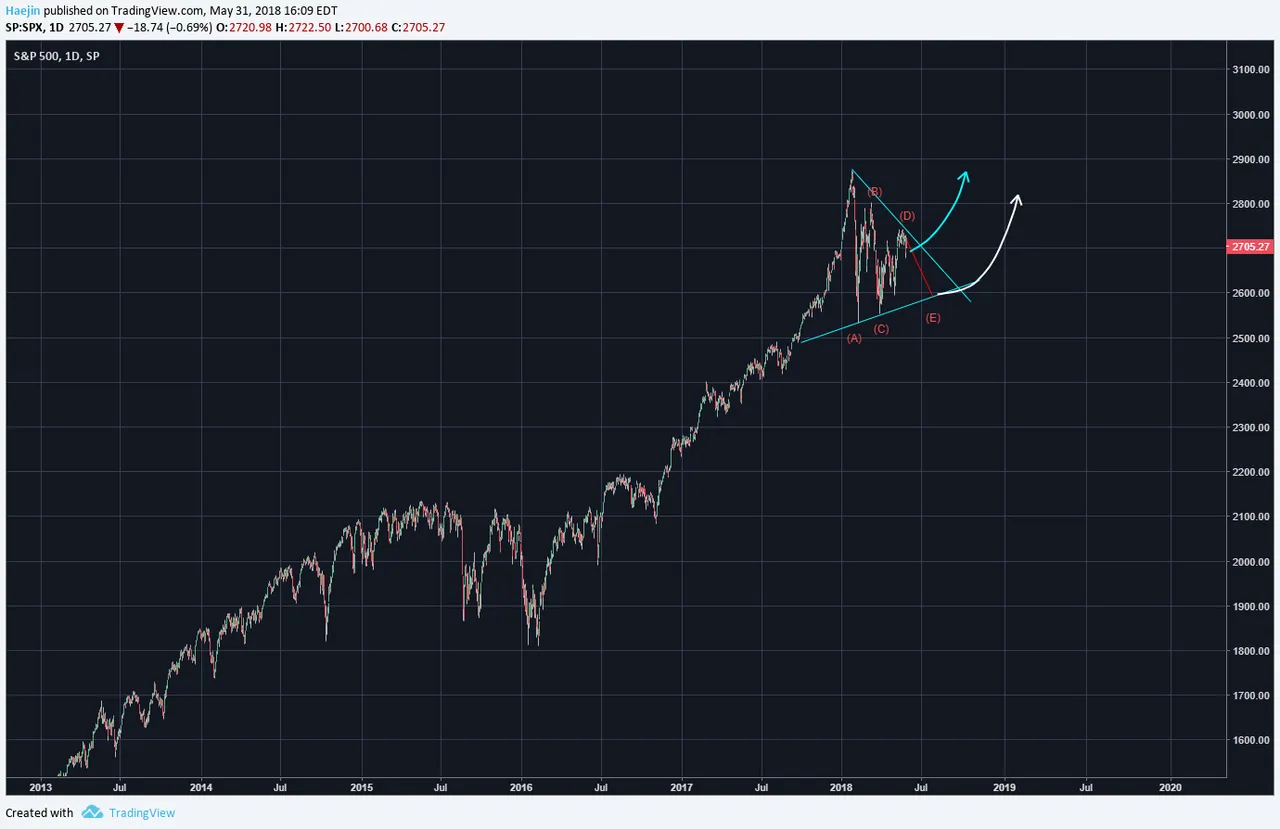
The S&P 500 Index (SPX) is likely patterning out a symmetrical triangle as shown in the below chart. The blue lines drawn across the tops and bottoms of the price bars are contracting and the ABCDE (red) waves show that all except wave E is complete. Keep in mind of the potential for a wave D breakout (blue arrow); however, I believe the E wave breakout is more likely (white arrow).
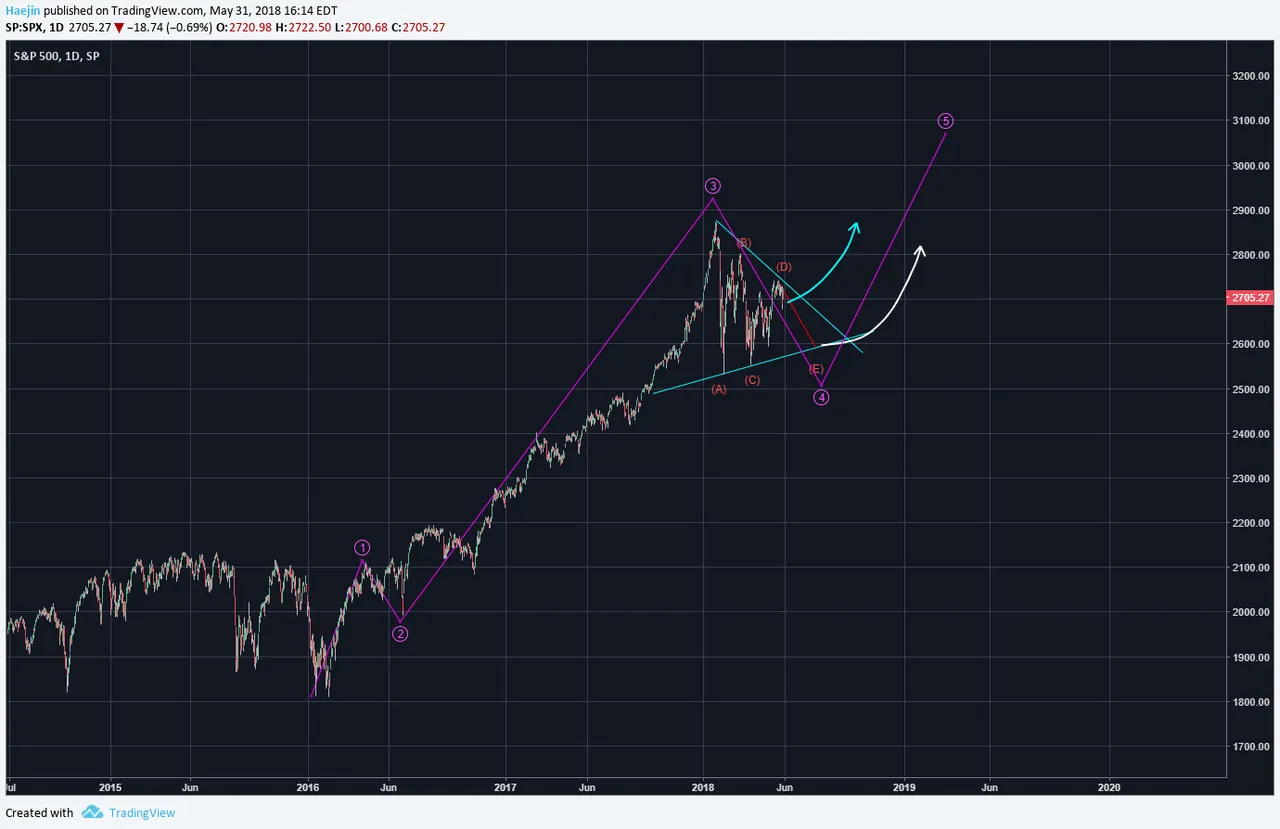
The purple Elliott Waves show that the symmetrical triangle pattern is coinciding with purple wave 4. Such patterns are almost always wave 2 or 4. When it is a wave 4, it almost always precedes a wave 5 or acts as a signal that a wave 5 is coming. It's quite consolidating for prices in this pattern and hence very rare to see it as a topping pattern process. So, once purple 5 gets in progress; new all time highs should be triggered. Video has more details.
Legal Disclaimer: I am not a financial advisor nor is any content in this article presented as financial advice. The information provided in this blog post and any other posts that I make and any accompanying material is for informational purposes only. It should not be considered financial or investment advice of any kind. One should consult with a financial or investment professional to determine what may be best for your individual needs. Plain English: This is only my opinion, make of it what you wish. What does this mean? It means it's not advice nor recommendation to either buy or sell anything! It's only meant for use as informative or entertainment purposes.
Please consider reviewing these Tutorials on:
Elliott Wave Counting Tutorial #1
Elliott Wave Counting Tutorial #2
Elliott Wave Counting Tutorial #3
Laddering and Buy/Sell Setups.
Laddering Example with EOS
Tutorial on the use of Fibonacci & Elliott Waves
@haejin's Trading Nuggets
Essay: Is Technical Analysis a Quantum Event?
Follow me on Twitter for Real Time Alerts!!
Follow me on StockTwits for UpDates!!
--
--

