
SUMMARY
Note: For anyone who missed the BitcoinLive Information Webinar, here is the replay link: 
As of June 4th, ALL Crypto Analysis will be posted on the BitcoinLive channel and Steemit will be dedicated for Equity, Commodity and Options Analysis. To Signup for the BitcoinLive limited Founding Membership slots, use this link: https://get.bitcoin.live/haejin/
__
BP P.L.C. (BP) has come a long way since the Deep Water Horizon crisis almost ten years ago, when one of it's deep sea wells were leaking and spewing oil off the Gulf of Mexico. That even coincided with the red A corrective wave as shown in the below chart. Before that, everything was just rosey! The impulse waves (white) had kept brining in newer and higher all time highs...until the correction, when wave 5 was completed.
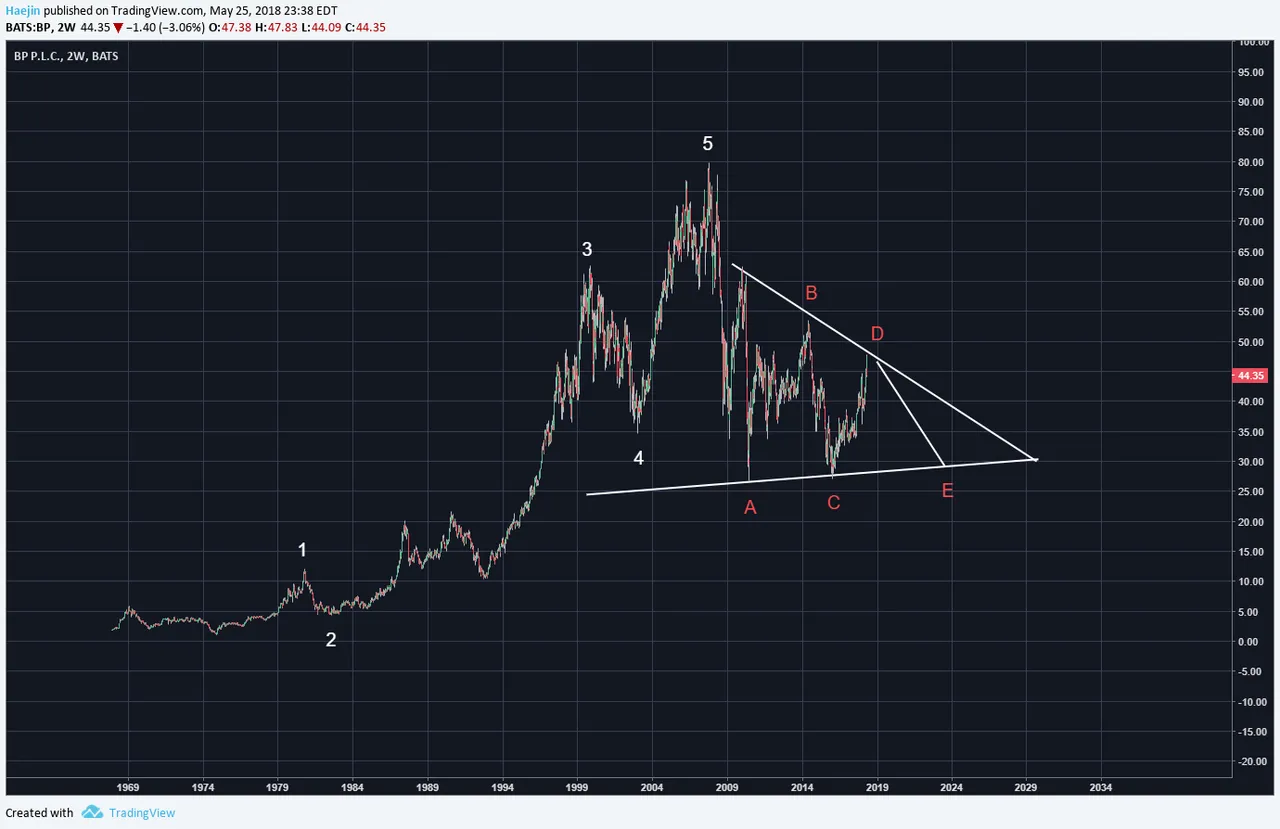
The ABCDE sequence has been sub-labeled as each breaks down into three (blue waves). The blue c of red A is exact wave the coincided with the Deep Water Horizon crisis. It's an example of how news and events arrive to justify the forecast. The remaining red B, C and D waves are also likely complete. That leave red E and its subwaves have been marked. This symmetrical triangle has the potential for a D wave breakout but given the toppy view of the overall market, the E wave will probably be required. It's after that when likely price will turn up again to deliver all time new highs. Would you be in a rush to buy BP?

Legal Disclaimer: I am not a financial advisor nor is any content in this article presented as financial advice. The information provided in this blog post and any other posts that I make and any accompanying material is for informational purposes only. It should not be considered financial or investment advice of any kind. One should consult with a financial or investment professional to determine what may be best for your individual needs. Plain English: This is only my opinion, make of it what you wish. What does this mean? It means it's not advice nor recommendation to either buy or sell anything! It's only meant for use as informative or entertainment purposes.
Please consider reviewing these Tutorials on:
Elliott Wave Counting Tutorial #1
Elliott Wave Counting Tutorial #2
Elliott Wave Counting Tutorial #3
Laddering and Buy/Sell Setups.
Laddering Example with EOS
Tutorial on the use of Fibonacci & Elliott Waves
@haejin's Trading Nuggets
Essay: Is Technical Analysis a Quantum Event?
Follow me on Twitter for Real Time Alerts!!
Follow me on StockTwits for UpDates!!
--
--

