These are some trading basic trading rules one should keep in mind that will help him/her from getting stuck in a position
and still making good profits out of the falling market.
Here are some of the rules:
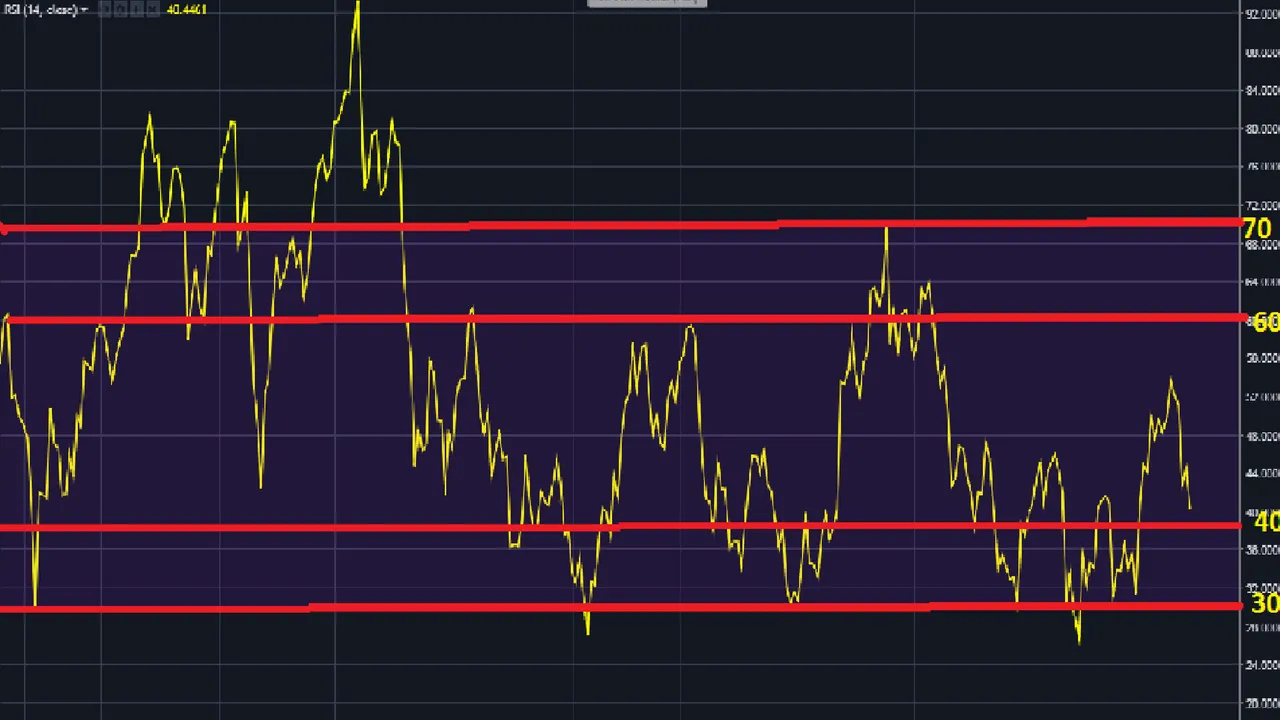
RSI or Relative Strength Index: (Whenever the price reaches above 70 it falls and whenever it reaches below 30 it goes up.)
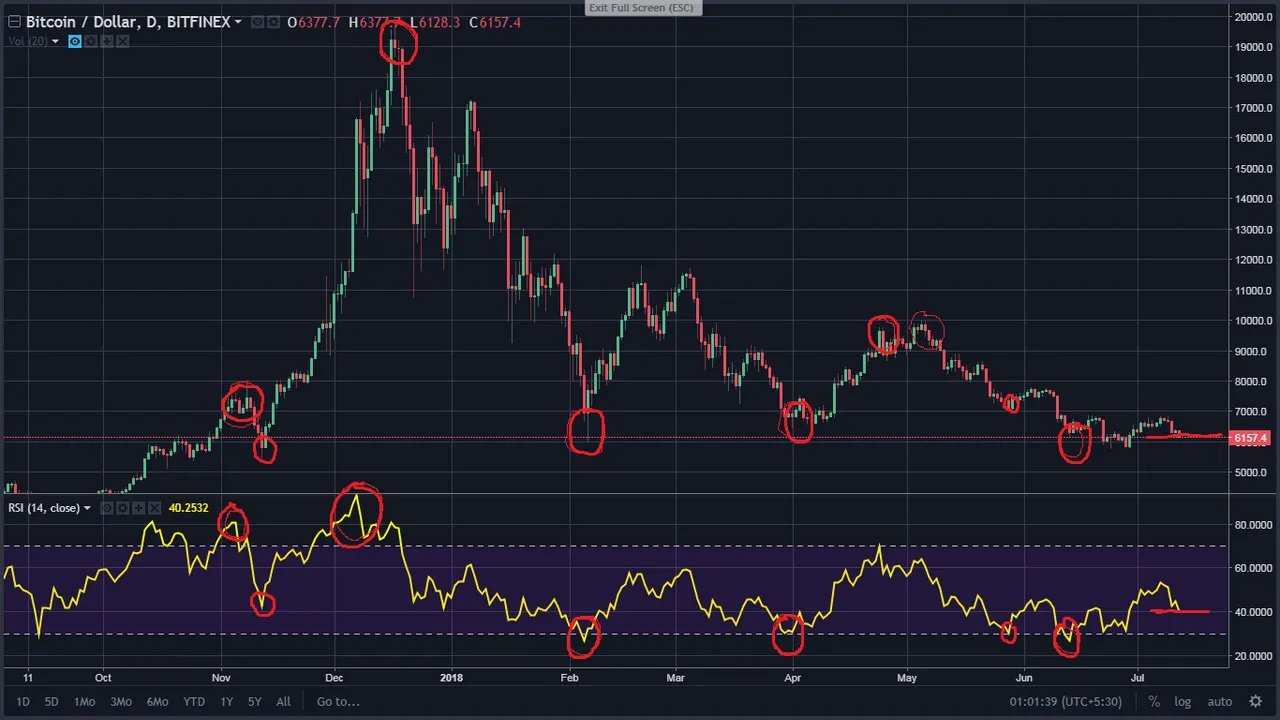
This chart shows the bitcoin price curve with RSI plotted. As you can see the RSI indicates the price movements very easily.
There is a violet coloured band having a lower line of value 30 and upper line value of 70. Now you can clearly see RSI touches 70 or above makes the price fall and when it touches 30 or below makes the price go up.Also, when the RSI is between 60 to 70, it is considered as a bullish sign whereas if it is between 30 and 40,
it is considered bearish and indicates that the market can go much lower than it is of at right now.
- MACD or Moving averages convergence divergence: (When the fast line is above it tends to move the price upside and vice-versa.)
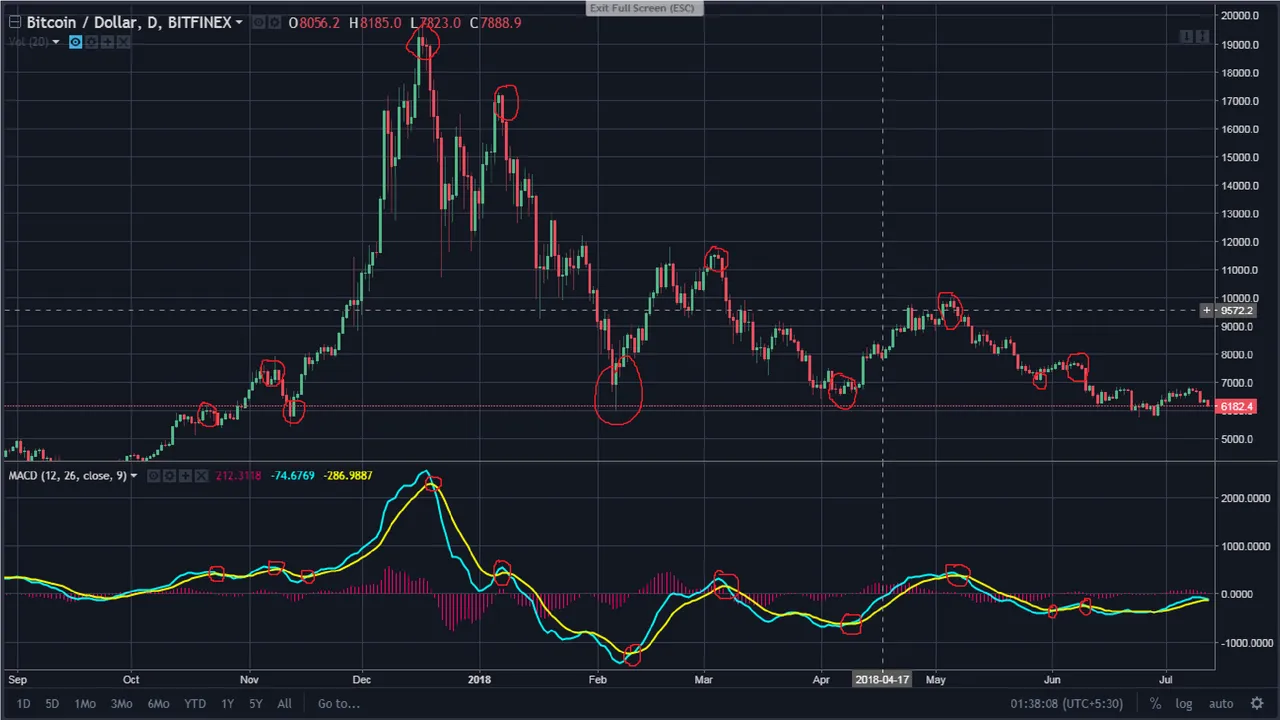
Here, you can see when the fast line i.e. the blue line is crossing the yellow line towards upside, the price also starts moving upside and the similarly when the blue line intersects the yellow line towards downside, the price starts going down too.
Hope these things will help you a bit in knowing your trades better and earn some profit out of it.