Hello steemit
You have know him,whom else??mathematician who famous until now
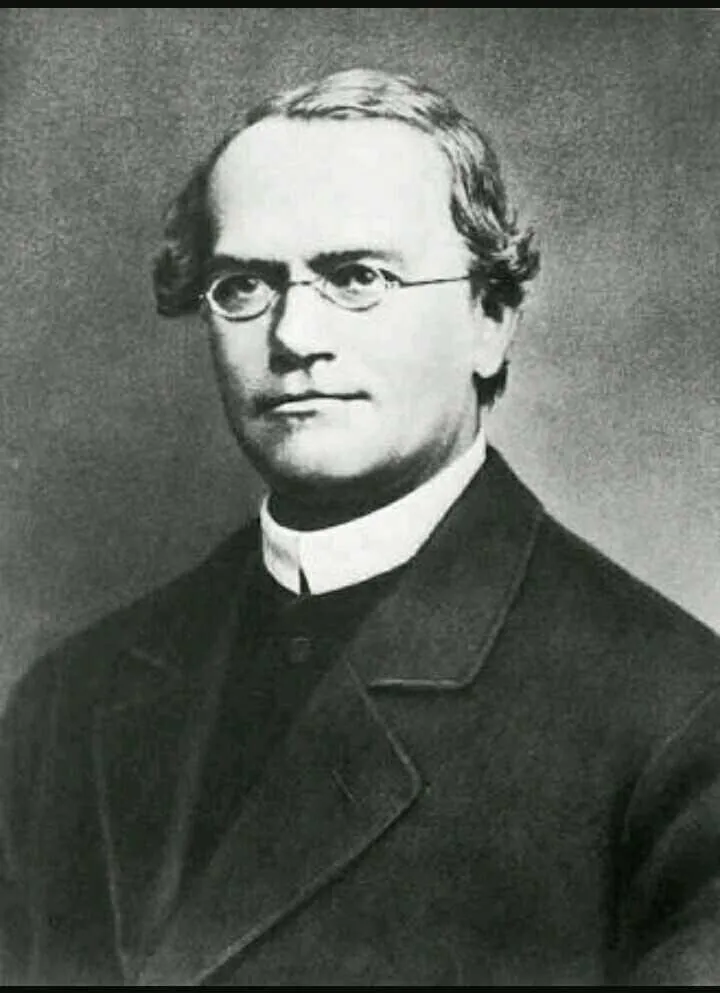
This is Gregor mendel,he is a botanist from austria.mendel formulated the basic legal basis to recognize the nature of heredity, his experiments in crossbreeding plants have an influence on the development of the science of genitika.ternyata, mendel using statistics to know the peas are down from one generation to another generation
Such as :
presentation of statistical data
Any two step for presentation of data which often are done. Like as :
a. list or table
b. charts or diagrams
a. presentation of data in table form
Example,result of math test value 30 students of class IX A junior high school
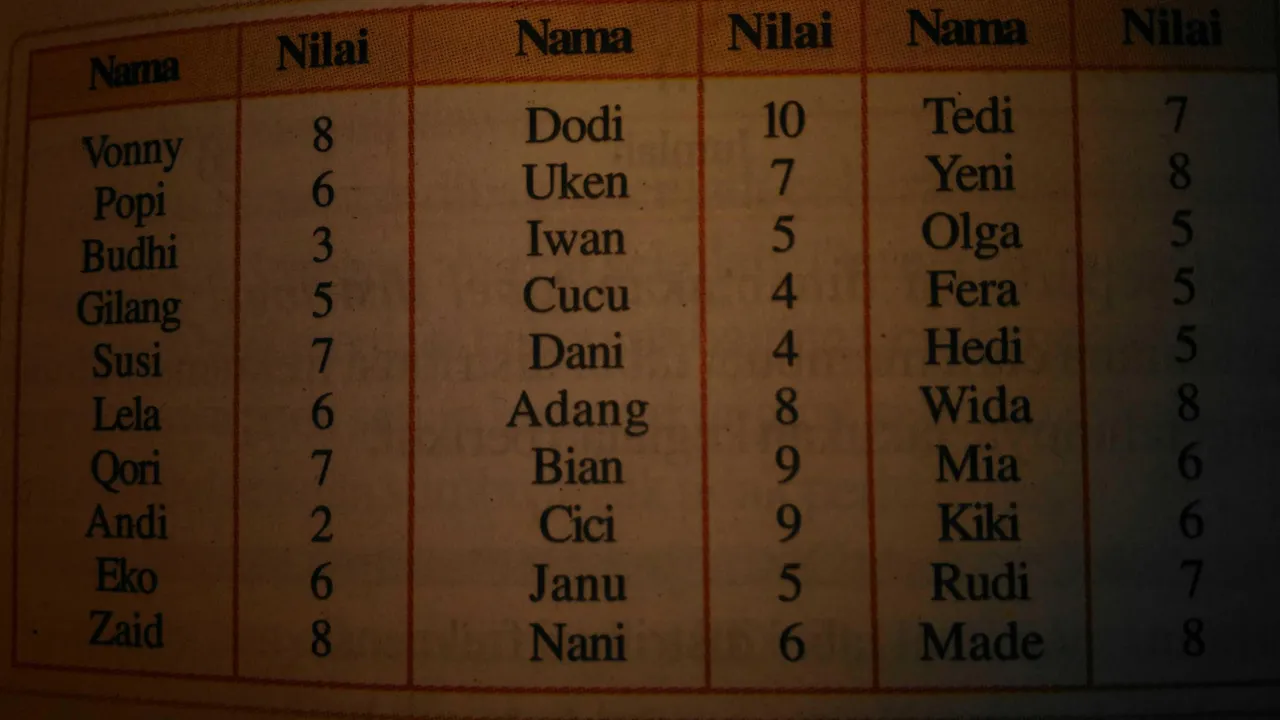
to find out how much math retrieval value is made, you have to read the data one by one for the data (30 datum), you can still search for it easily even though it needs sufficient time.
b.presentation of data in charts form
you already know the bar charts, lines, and circles. In this section I will tell you how to restate the digram data. In addition, I will introduce the way of presenting the data with the pictogram.
1. bar charts
Bar charts is one of charts form which could used for presentation of data.
this is the shape of the picture :
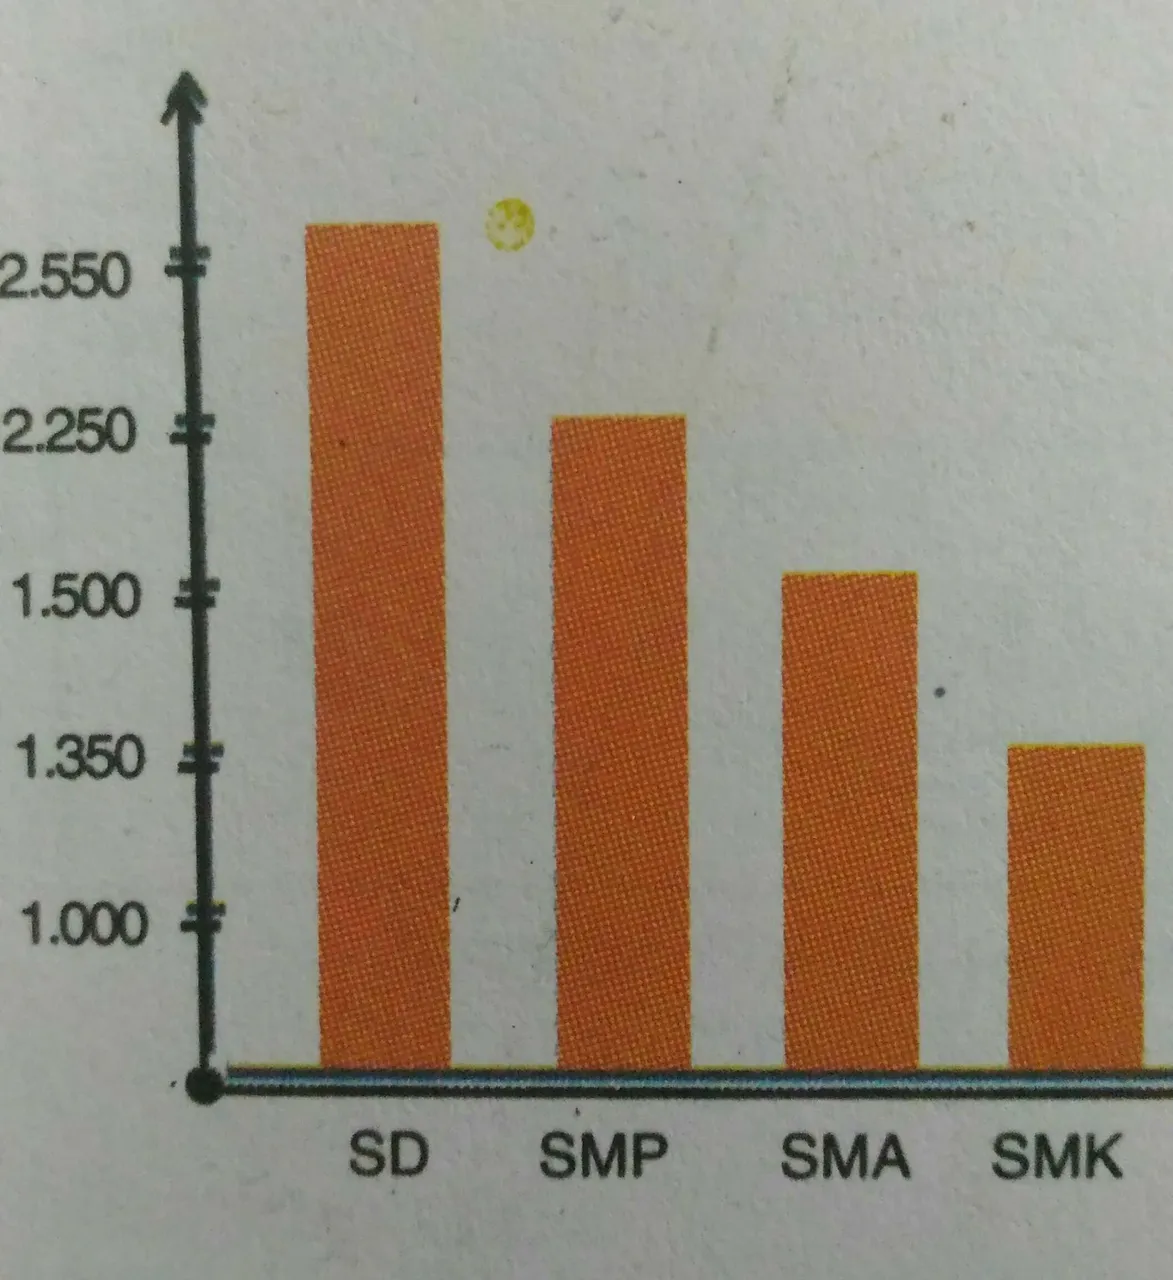
a. horizontal axis is used to indicate the type of category, such as elementary, junior high, high school, vocational school.
b. the vertical axis is used to indicate the frequency, for example many students
may be only this that I can give to you may be useful for you all....see you
steemit education