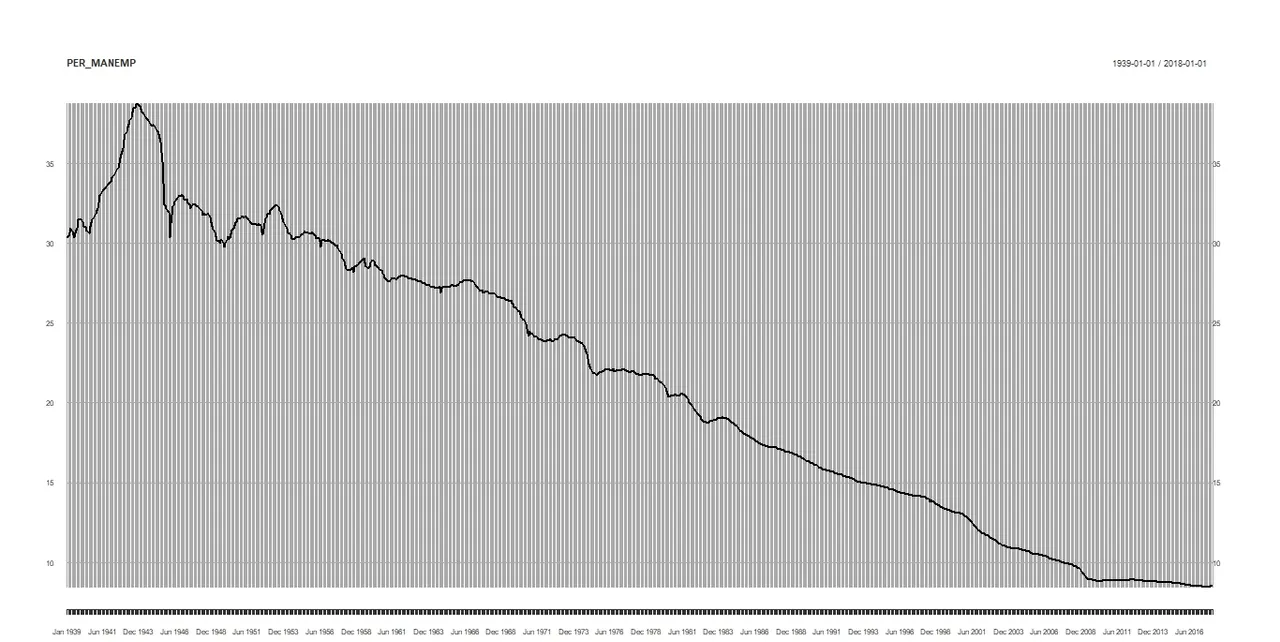
The following chart shows the share of manufacturing in the total non-farm employees, which has been steadily decreasing for a long time. The proportion of manufacturing in the 1950s was about 30%, but it dropped to 10% before the financial crisis and then fell more to 8.5% after the financial crisis. As a result, many jobs in many manufacturing sectors have disappeared.
다음 차트는 비농업 종업원 총 생산에서 제조업이 차지하는 비율을 보여주는데 오랜 기간 꾸준히 감소하고 있었습니다. 1950 년대 제조업이 차지하는 비중은 약 30 % 였으나 금융 위기 이전에는 10 % 까지 감소했고 그이후에는 8.5 %로 떨어졌습니다. 따라서 많은 제조업 부문의 일자리는 사라졌습니다.
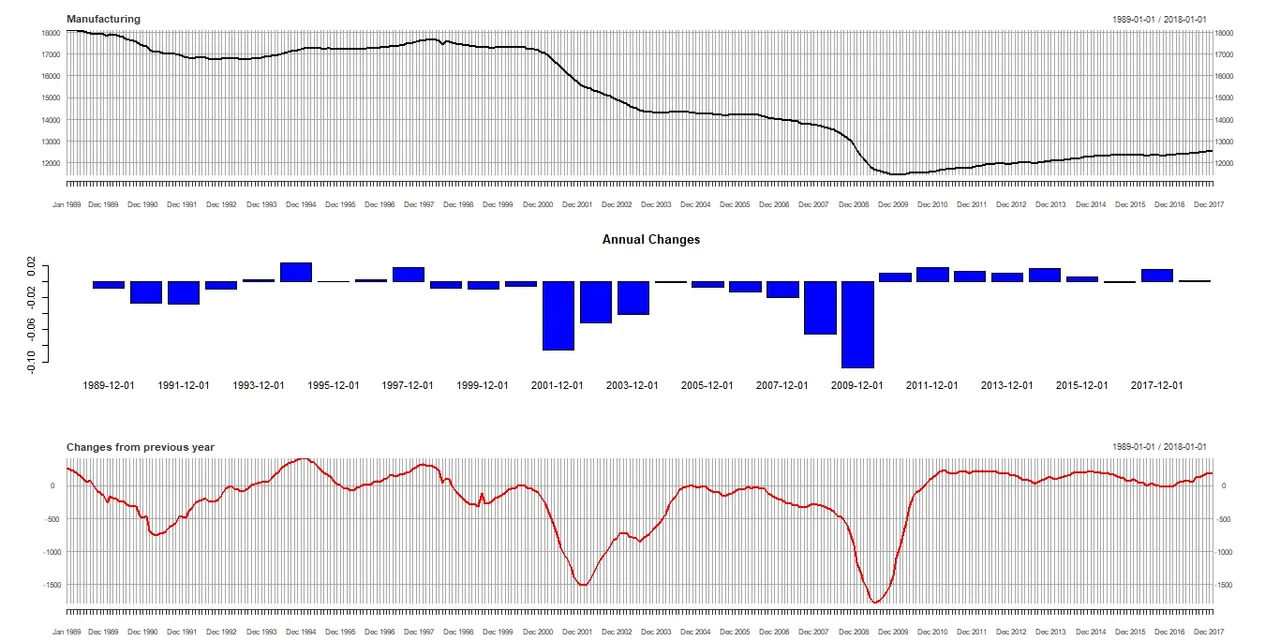
The chart below shows that manufacturing employment has declined over the past 30 years. The employment in manufacturing has plummeted to 8.5% during the financial crisis and recovered a little after that, but it is still below before the financial crisis.
아래차트는 제조업피고용 이 지난 30년동안 하락하는것이 보입니다. 제조업이 금융위기로 급락했다가 그이후에 회복했지만 아직도 금융위기전에 못미칩니다.
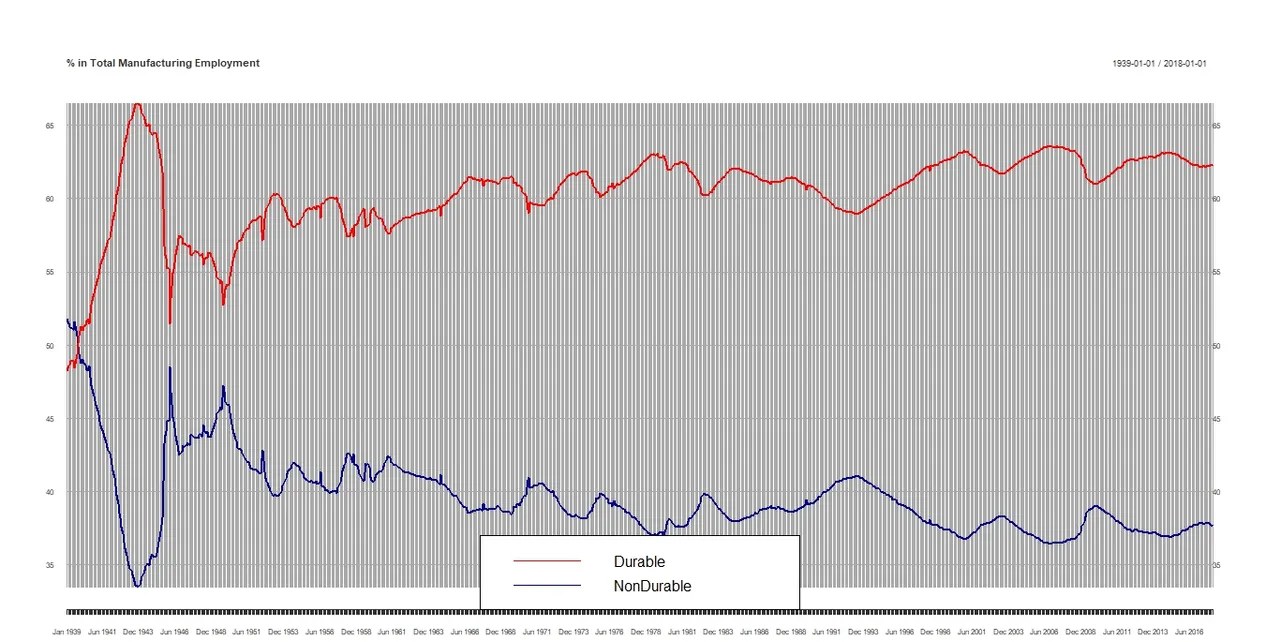
The following chart shows the percentage of durable and non-durable sectors in the manufacturing sector. The employment in durables accounted for 63% of manufacturing and 37% of manufacturing are employed in non-durable good producing sector. Employment share in the durable goods sector declines during the recession. It is more sensitive to the business cycle.
다음 도표는 제조업안에서 내구재 및 비 내구재 분야의 비율을 보여줍니다. 내구재 가 생산 부문의 고용은 63 % 정도을 차지하고 비내구재의 고용은 37 % 정도을 차지합니다. 내구재 부분의 고용 점유율은 경기 침체 기간 동안 감소합니다.
The following chart shows the employment in durable good producing sector.
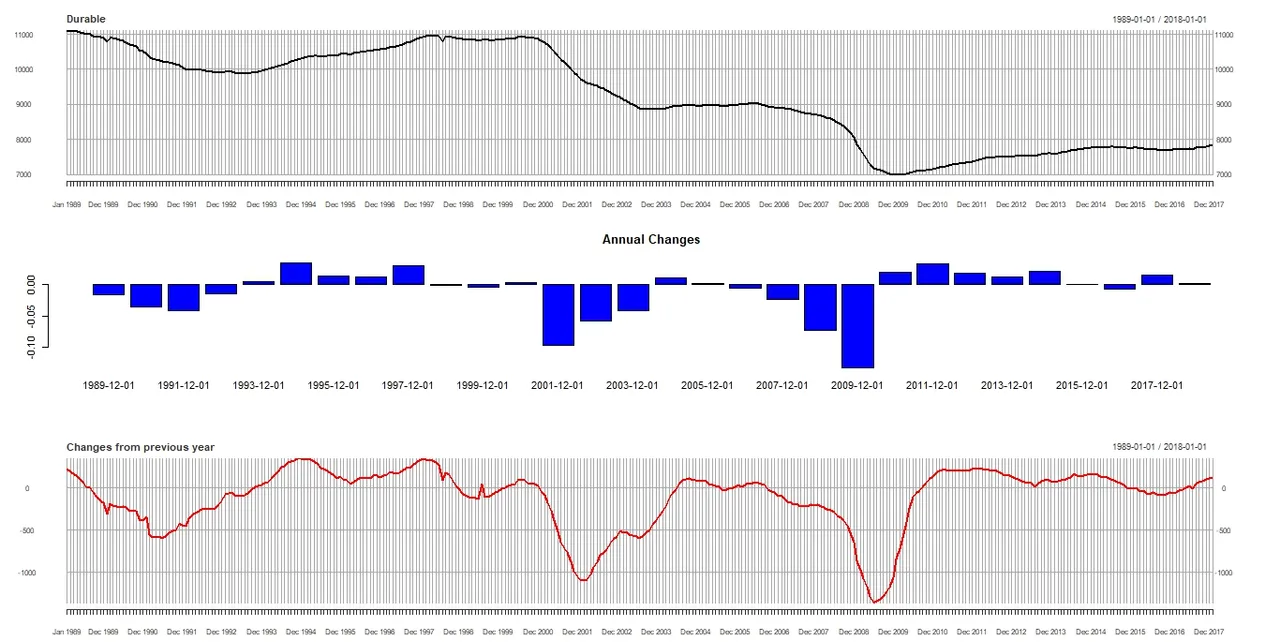
Note: The data for 2018 is as of January 2018.
The following chart shows the employment in non-durable good producing sector.
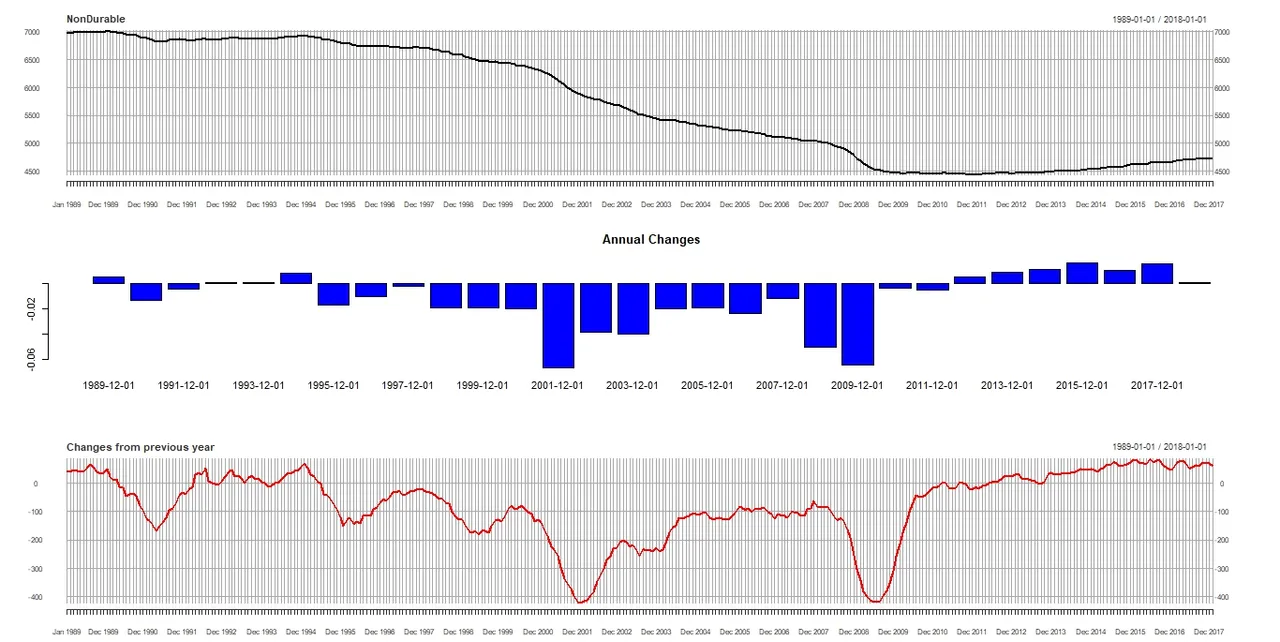
Note: The data for 2018 is as of January 2018.
Source: