After breaking down out of a very clear descending triangle on the daily, LTC has never looked back:
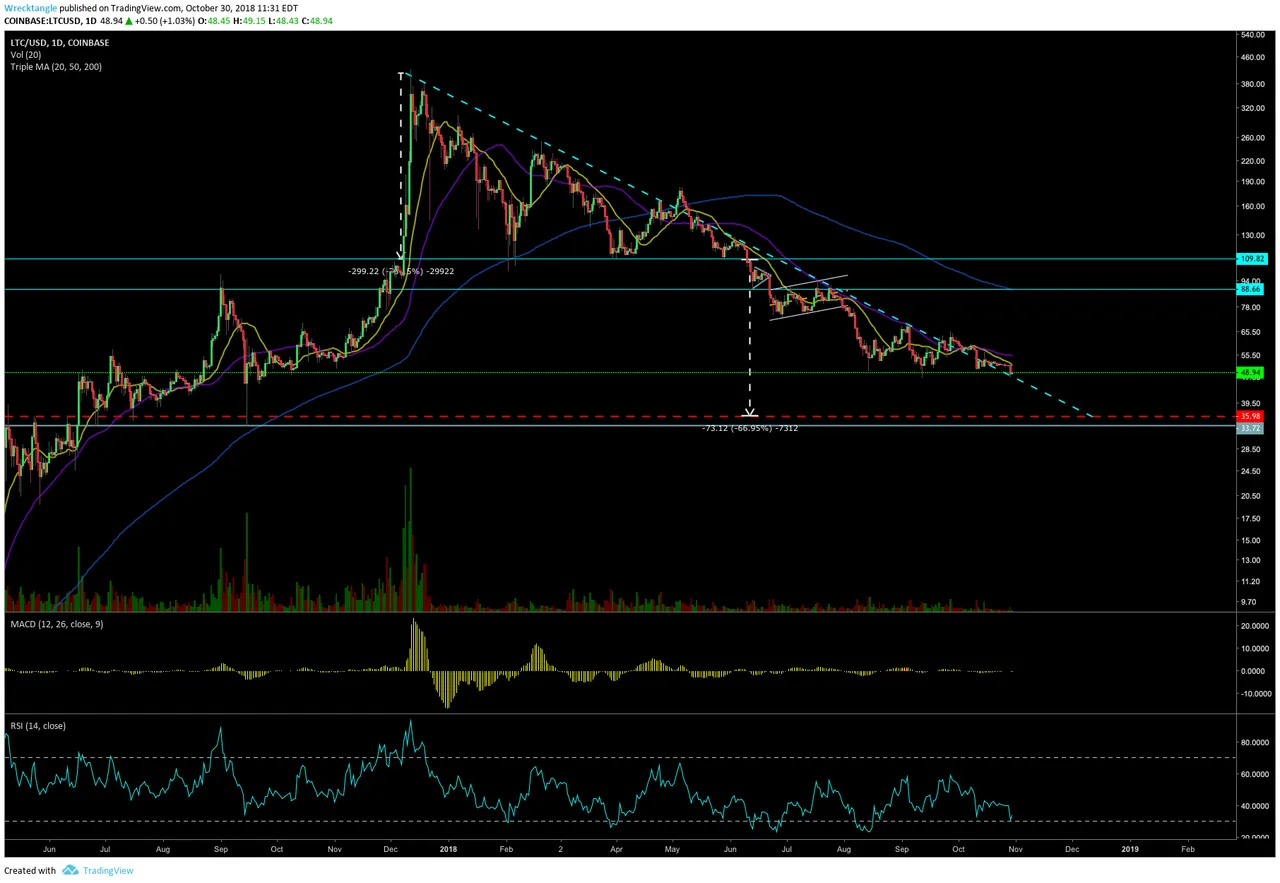
Currently, we are struggling to stay above the long term diagonal trend line. This trend line has served to be the perfect overhead resistance level for LTC since the peak. We never got a valid break through it in close to a year. We've only used it as resistance before selling off. We are sitting on top of it as we speak, however, this will most likely come back considering we have no volume and we are currently below all your moving averages. We are also seeing the more shorter MA's start to curl down harder. Your RSI has made lower lows so we currently don't have any divergence yet. Your MACD is showing a tiny bit of bullish divergence. It's early on so another move down could negate that divergence so just be patient. Both oscillators aren't in sync and that is a must for me to make a divergence call.
The good news is the measured move (red dotted line) looks to be at $35.98, where we could see LTC start to carve out its bottom. This zone is also in line with your horizontal resistance level, which is at $33.72, so hopefully that could be enough to find our bottom. In the process of carving out our bottom, we could start to see the price move further above the dotted diagonal resistance line. That would be good to see since we've never managed to stay above that area with any conviction. That is my most optimistic scenario. A break below this area would not be good. LTC must hold the red line or the horizontal support or LTC will be in very bad shape. It is a low risk entry play if you were sitting on your hands the past year.
Moving forward, you see some light at the end of the tunnel and it appears LTC is close to ending this down trend. We just have a little more room downward to go.