

General Tone:
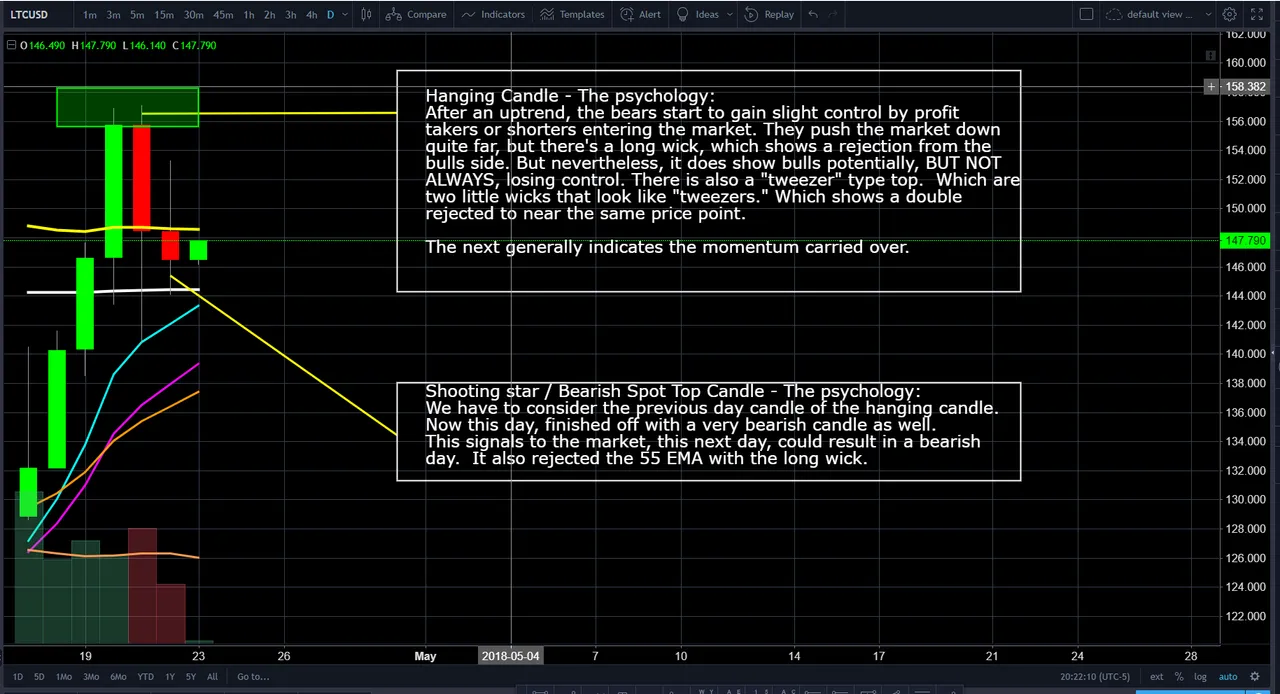
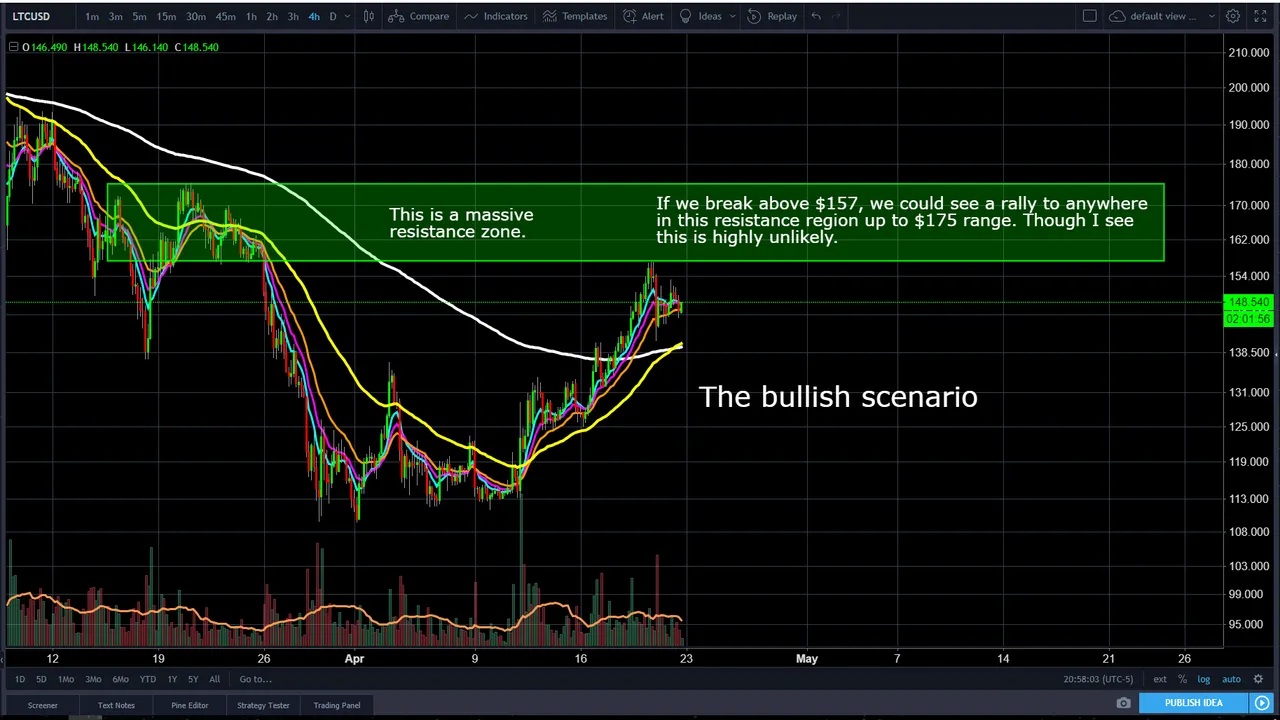
LTC shows more signs of bearish divergence than bullish. A hard support range is near $136. A Break above $157 though, we could see up to $175 range AT MOST, which is a massive resistance zone, so anywhere from $157 to $175 is risky trade in terms of probability.
Long Term Bias (6+ months) - Bullish
Medium Term Bias (Next Week) - Neutral to Bearish
Short Term Bias (Today) - Bearish
Long Term Target Prediction - By 2019, $1,000+
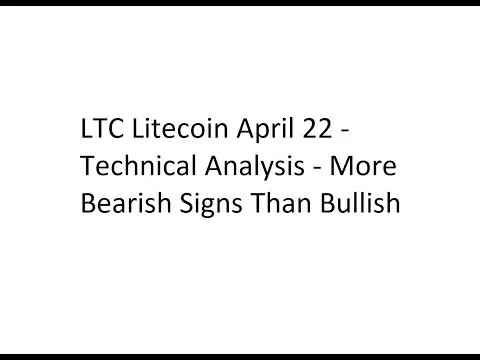
The bearish scenario
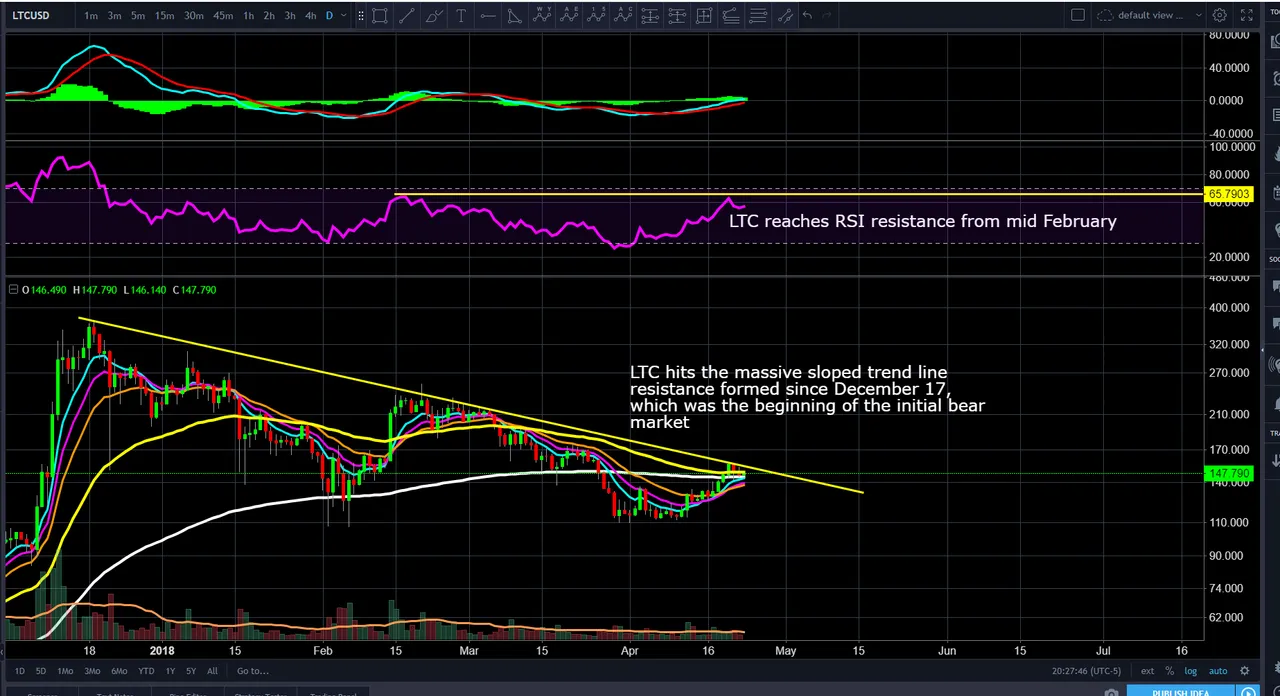

The bullish scenario
These lessons below are on par, if not much better,
than every trading package sold and available on the internet that could cost you thousands.
My Comprehensive List of Tutorials
Please consider upvoting if it has helped you
Please consider purchasing me a 33 ft' yacht
if you have reached incredible success. Click Below!

If you appreciate my work, help support the Luna (my dog) and Philakone Crypto Fund to always keep everything free.
BTC: 357j3P2CuybfWh13V4uig9TJDJdqiR8CMx
NEO: AYBJHjrQFQij7kCmwun97PVEiRkRgFamMn
EOS: 0xc7a004b214db83bb05eee99f3d0e06ad02b858fc
Ethereum: 0xc7a004b214db83bb05eee99f3d0e06ad02b858fc
LTC: LL7misJsxX8kDzjnbvxupetVykCP58B1ZD
Bitcoin Cash: 199rQASMB5zVe9nEWwG34n1jEL24bYxCFz
XRP Address: rLW9gnQo7BQhU6igk5keqYnH3TVrCxGRzm / Wallet: 120086840