
SUMMARY
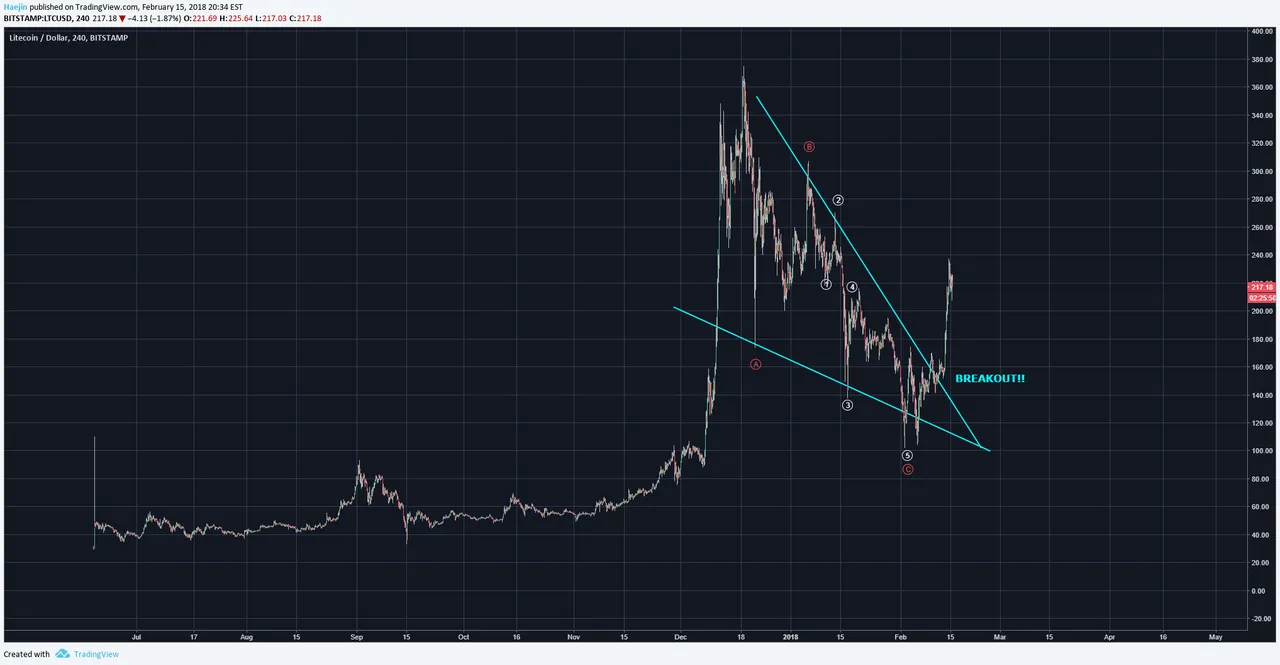
Litecoin (LTC) is showing what a breakout really looks like! Price moves vertically and impulsively. Following the ABC flat correction, Litecoin has breached the upper blue line and had been surging in a more vigorous fashion than Bitcoin!
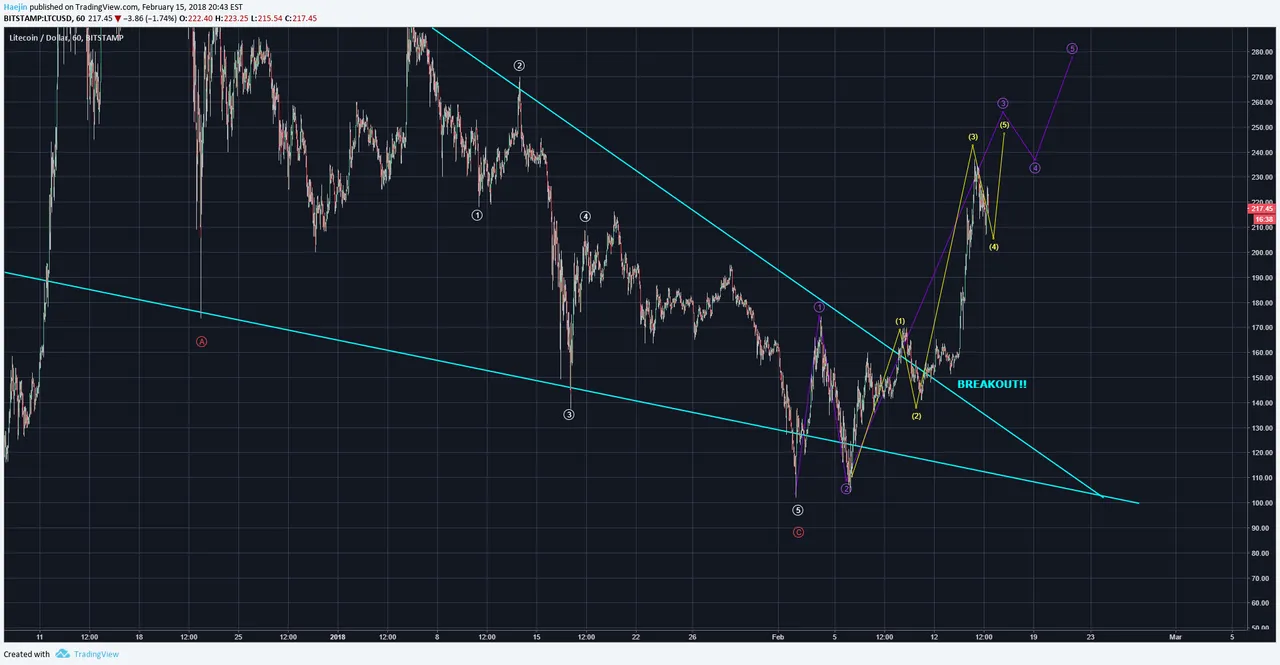
The closeup shows that white wave 2 made a near 88% retracement of white wave 1; but still, it obeys the wave 1,2 interaction in that wave 2 doesn't equal the start of 1. So, technically, wave 2 could retrace upto 99% of 1 and still be valid. Wave 3 is also perhaps complete and if not so, current price action could be working on wave 4 followed by 5.

There is a scenario where wave 3 is not yet complete and as shown by the yellow subwaves, price could still be working on the subwaves of purple 3. Given how vertical price had borken out, the vigor could extend to provide this current as the primary count. Once the five waves are complete; there would near zero argument for a three waveish type of bounce to describe the current breakout. A bottom could also be called! Let's see how the overnight price action moves.
Legal Disclaimer: This is only my opinion, make of it what you wish. What does this mean? It means it's not advice nor recommendation to either buy or sell anything! It's only meant for use as informative or entertainment purposes.
Please consider reviewing these Tutorials on:
Elliott Wave Counting Tutorial #1
Elliott Wave Counting Tutorial #2
Elliott Wave Counting Tutorial #3
Laddering and Buy/Sell Setups.
Laddering Example with EOS
Tutorial on the use of Fibonacci & Elliott Waves
@haejin's Trading Nuggets
Essay: Is Technical Analysis a Quantum Event?
Follow me on Twitter for Real Time Alerts!!
Follow me on StockTwits for UpDates!!
--
--

