Hi There!
I guess I should just explain what happened today as I was creating the chart for Hive to explain that there was a QFL (Quick Fingers Luc) trade available on Hive at that moment. I had drawn my markings on the chart and had to go out but was going to post it later. Then, BOOM, before I got the chance to post it, Hive took off way beyond the target!
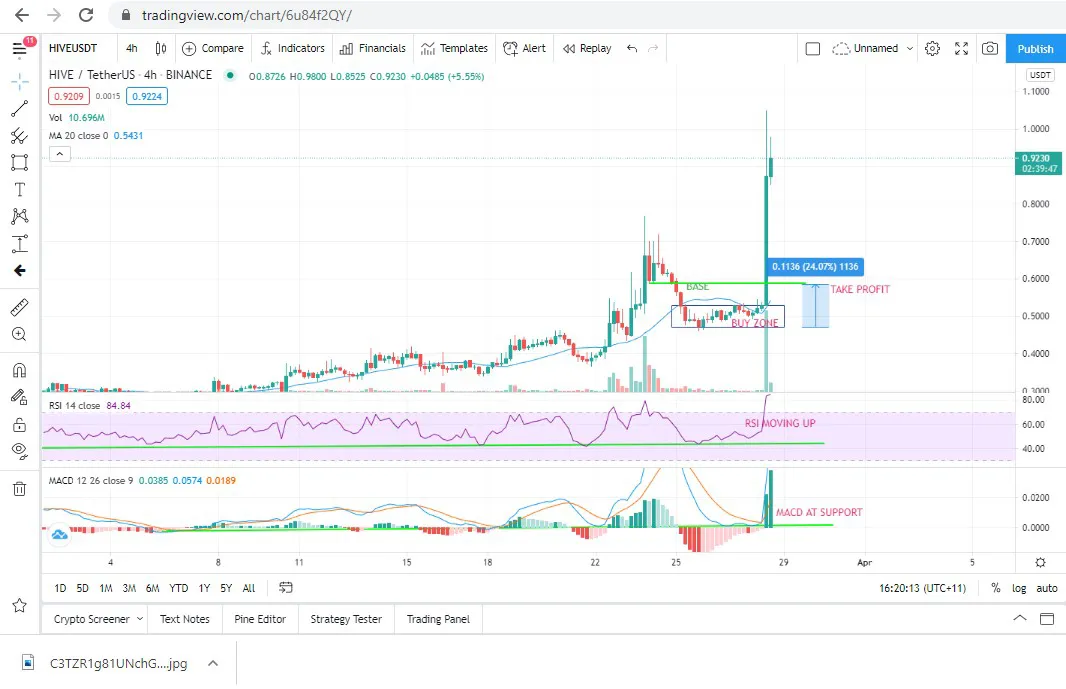
The QFL method is activated when there is a drop below a previous "base". The chart is 4 hourly candles. It's usual to wait for at least a 5% to 10% drop below that base to place the first trade. If it drops another 5% to 10% you can add another buy to dollar cost average the trade.
So, looking at the chart, there had been a break below the previous base to around -24%. The take profit target is set at the price at which the base was formed.
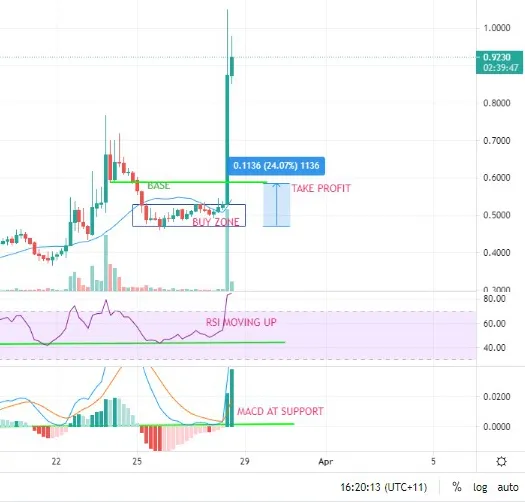
So, as the giant green candle made its shoot up, it surely would have hit the profit target quickly but continued to shoot way above. If using this strategy, you cannot be sorry that you missed out on the rest of the pump unless you chose to use a trailing stop loss or have kept the profit in the specified coin.
The aim of the strategy is to either sell all of the coins at the profit target or sell the initial investment at the target, leaving profit in the purchased coins (which would then, of course, have benefited from the further pump).
So I hope that explains some of the QFL method. I hope to post some historic charts soon demonstrating how reliable this method can be.
Here's the full chart. Which I created just before the pump happened! The latest candle had just reached the top of the "Buy Zone" box when I was adding the comments.