Received a lot of messages on how to read charts, but the problem is that there are many different type of stock charts such as line chart, barcharts, open high low close charts, mountains, point and figures, candlesticks, and many other types of chart indicators available for investors. The charts are used to show the historical data and movement of a stock security, currency, or commodity. Using the historical data, and chart patterns we can use the information that is given to us to help us make predictions on where the data is taking us.
Because there are so many different charts available to use, I usually use the chart depending on what I am interested in trading. If its a security that I am researching, I will use a combination of both line graph, and indicators. If its currency, I will use candlesticks and look for candlestick patterns.
Since I mostly talk about Litecoin, a digital currency, on Steemit, we will be exploring candlesticks. Candlesticks is one of my favorite charts because it shows the highs and the lows, and will be usually highlighted green/white to let you know it moved up at that moment, or red to let you know it moved down, so you get a visual on the price activity.
Another cool thing about candlesticks is that the body of the candlesticks shows you how high, or how low that candlestick has moved.
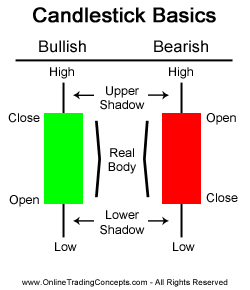
After you know and understand the body which is fairly simple, you can understand the shadows. In that same photo, the high and the lows, represent the shadows. They are the lines above and below the candlestick body. The upper tip represents the highest price point, and the lowest tip represents the lowest trade.
Once you master that, then time is important. Time is very important because if you use a historical candlestick chart for a 1 hour chart, then that will just provide you information on where the price is going for that next hour. 1 Day charts, will determine the price for the following days, 1 month chart will determine the price for that next month, and so on.
Because of the body, and depending on the length of the body, and time, we can use all that information to see patterns in the chart. There are over 10 patterns and indicators that help you show where the price is potentially moving, and once you figure that out there's candlestick patterns that help be your guide. One example is the shooting star formation.
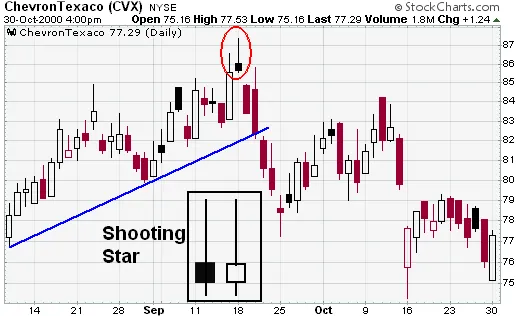
As you see that security was in an uptrend, and all of a sudden, on that one day the star was born the price moved way up, before reversing and falling back down showing a downward star, or a shooting star. This is one sign that the price may drop, and as you see a few days later, the price dropped.
Seeing things like that is very beneficial on how to trade because it can show you when to enter or exit a security. If you can get out, and follow the pattern for a reentry point after it falls, you're making money on the short term, while going long at the same time.
So where to begin?
One site that helped me was, the chart school powered by stockcharts.com. They break down the charts in a step by step process and they talk about all charts, and chart patterns. Once I learned the concepts above, I learned even more on the chart school. It was a great learning tool because they start with the basics, and slowly work you up to the advance knowledge of reading stocks.
http://stockcharts.com/school/doku.php?id=chart_school
As I read along, I would compare what I read with real life charts to try to make my own predictions of where the price was heading. I would write down the time and date I made my prediction and if I used a 1 month chart, I would come back a month later to see if my prediction was right or wrong.
I would also learn on YouTube. One creator that helped me was a creator called, "YourTradingCoach", he breaks his videos down in volumes, and similar to the chart school, he starts with the basics, and works his way up to the advance knowledge of trading stocks. His videos are well detailed, and well informed.
His link for volume 1 is below:

If you're serious about learning charts, and candles, I urge you to start learning now, and really learn the information provided. It is very important when it comes to making money and will help you become a better knowledgeable trader, and investor.