Markets show some upward energy. I bite the bullet on Cisco and Rare Earths & Strategic Metals (maybe early). Busy session writing covered calls and benefiting in strong move up in implied volatility = more premium for more cover.

Portfolio News
Market Selloff
Markets take good heed of White House talking down the fear of recession and moves higher with yields also rising.

Mainstream media helps with CNBC focusing in on the strength of the consumer, all day. If the consumer stays strong through the upcoming holiday season (still 3 months away) recession will not happen in 2019 is the message.
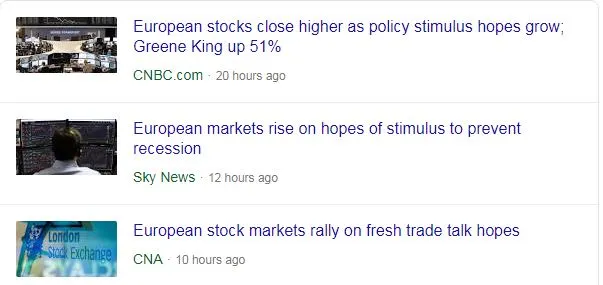
European markets followed the Asian lead. China did say they were talking. And Germany started dropping hints about fiscal stimulus. This is something of a shift as they have been relying on monetary stimulus till now.
There are hopes Germany will ditch its obsession with running a balanced budget.
This is a big deal if they live up to the words.
https://news.sky.com/story/european-markets-rise-on-hopes-of-stimulus-to-prevent-recession-11789088
Bought
Cisco Systems, Inc (CSCO): Network Equipment. I watched market open higher than the Friday close and bit the bullet and bought stock in the portfolio I was not allowed to take delivery of stock on Friday. There were enough funds. I figured with a net income of $1.38 a share achieved this year writing naked puts and one naked call I would soon pass breakeven ($48.62). Price advanced 3.28% to close at $48.50 - not far from my breakeven.
VanEck Vectors Rare Earth/Strategic Metals ETF (REMX): Rare Earth/Strategic Metals. I also bit the bullet and increased my holding in this ETF, after buying back the sold 13 strike puts on Friday. Price inched up to close at $12.77 - a little below the price I got at market open. Options markets only goes out to February 2020 - not really conducive to a options trade until I see prices actually start to move. There will be new options opening in September.
Sold
AT&T Inc (T): US Telecom. With price closing at $35.38, closed out part holding of January 2020 32/35 bull call spread for 162% profit since May 2019. Not sure why I only closed part holding as price has gone past the top of the spread. I am also holding January 2020 33/42 bull call spread. Quick update of the chart showing the trade part closed as the pink rays and the other trade as blue rays.
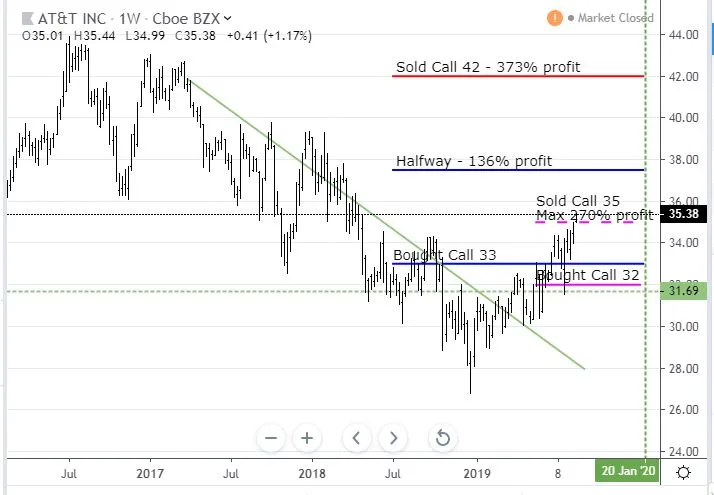
The chart shows a classic break out pattern with weekly downtrend broken, retested and pushing on. There is enough steepness in the price curve for price to reach the halfway profit mark on the other trade. I have my doubts as price normally likes to pull back in cycles before a push higher. I will be monitoring this to see if there is a turn back for a 3rd leg higher - we have had two already.
Shorts
iShares U.S. Real Estate ETF (IYR): US Real Estate. I decided to have another go at this toppy chart formation and bought an October 2019 92/88 bear put spread for a net premium of $1.13. This offers a maximum profit potential of 253% if price drops 4% from opening price of $91.50. Day did not start the journey well with price rising 0.78% to close above the bought put strike (92). Let's look at the chart which shows the bought put (92) and 100% profit as red rays and the sold put (88) as a blue ray with the expiry date the dotted green line on the right margin
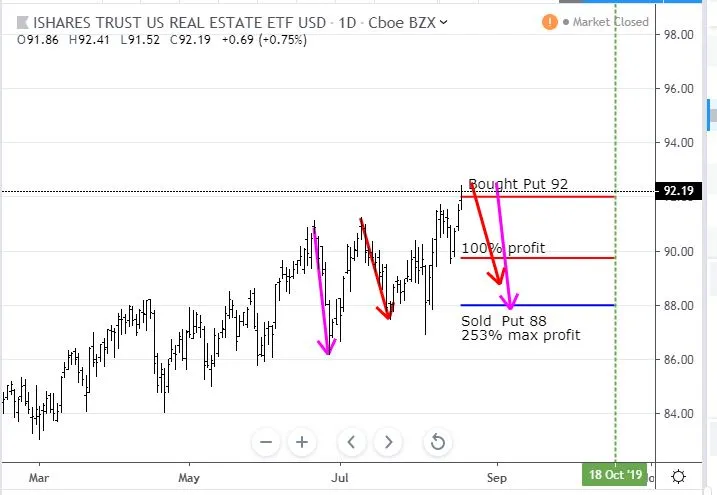
What I like is the sold put level (88) is above 3 of the 4 last cycle lows (and above the 3 really low ones). The red arrow price scenario is the median price drop from my last contract (3 cycles = shorter and less steep). Get a repeat of this type of move and trade will make 100% profit. Get a repeat of the steeper drop and the trade will make the maximum (depending of course where price turns from at the top).
There is only one Federal Reserve meeting scheduled (September 18) before expiry. October meeting is after expiry.
Income Trades
46 covered calls written at an average premium of 1.56% to Friday closing prices with price cover average of 9.85%. This is an appreciable increase in average premium (0.98% last month) and cover ratio (8.8% last month).
I will skip sharing the table - it is too big.
Cryptocurency
Bitcoin (BTCUSD): Price range for the day was $673 (6.5% of the low). Price breaks firmly after 2 inside bars and inches up to test two short term levels tested during July - hard to say how strong these are.
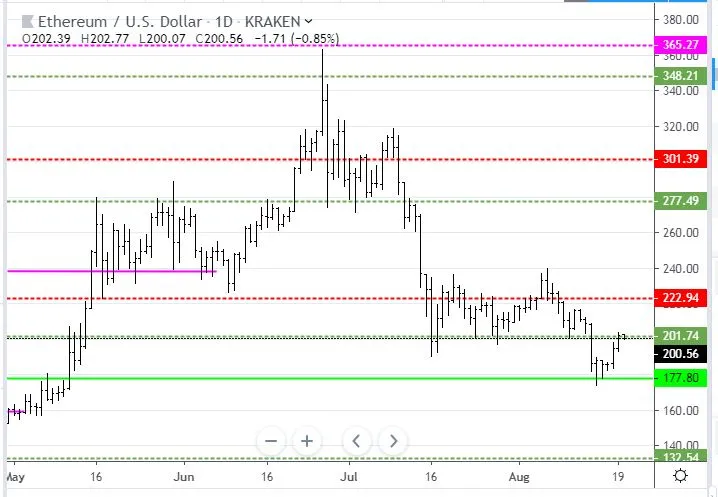
Ethereum (ETHUSD): Price range for the day was $10 (5% of the low). Price inches above resistance at $202 and makes a new high. There could well be a tussle with sellers at this level.
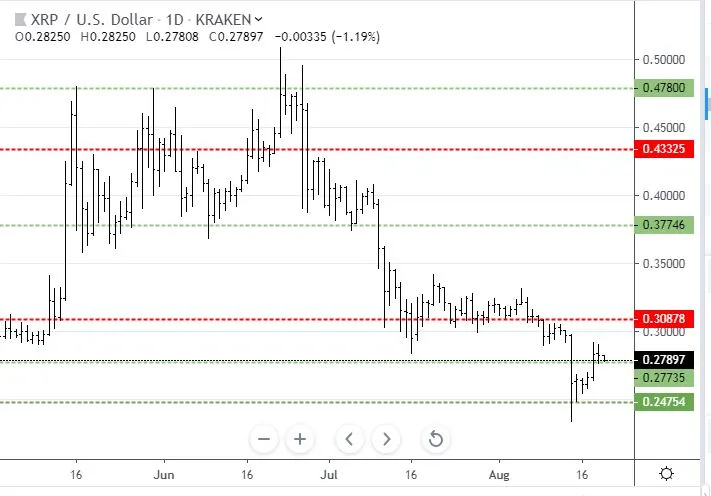
Ripple (XRPUSD): Price range for the day was $0.01439 (5% of the high). Price action is different here with price just rejecting the psychology of the $0.30 level and making an inside bar. This needs to gather here for a while before it will take on that level.
CryptoBots
Profit Trailer Bot No closed trades
New Trading Bot Trading out using Crypto Prophecy. No closed trades
Currency Trades
Outsourced MAM account Actions to Wealth closed out 4 trades on AUDNZD for 1% profits for the day. No trades open
Cautions: This is not financial advice. You need to consider your own financial position and take your own advice before you follow any of my ideas
Images: I own the rights to use and edit the Buy Sell image. News headlines come from Google Search. All other images are created using my various trading and charting platforms. They are all my own work
Tickers: I monitor my portfolios using Yahoo Finance. The ticker symbols used are Yahoo Finance tickers
Charts: http://mymark.mx/TradingView - this is a free charting package. I have a Pro subscription to get access to real time forex prices
August 19, 2019