Time to shuffle the decks in marijuana and ride a burgeoning gold price.

Portfolio News
Market Rally
US Markets continue to do what markets like to do - focus on data
The earnings data has been upbeat enough to keep the market drifting upwards. A softer Fed is helping. I was happy to see Alphabet price (GOOGL) move ahead and hold above the 1100 sold put level.
Cannabis Carnival
The cannabis carnival is something of a challenge for Wall Street as they face a confusing jungle of legislation and regulations and even simple problems like firewalls blocking researchers.

Goldman Sachs projects an industry of only $80 billion. Most commentators are in the $150 billion range. I am going to guess it will be double that at least ($300 billion). Wall Street will find a way to come to the party. Note: I did ignore the penny stocks article - they are all over the counter stocks in US. I prefer to invest in regulated legislated markets (like Canada)
https://www.cnbc.com/2019/02/04/wall-street-banks-face-hurdles-as-they-rush-to-cover-marijuana.html
Gold
With a changed tack from the Federal Reserve, all the talking heads have come around to talking about gold

I have been noticing my hedging gold trades quietly creeping up from the 2018 lows and taking a step ahead when the Federal Reserve slowed down the rhetoric on rate hikes. Gold price does not like rising interest rates as people can earn a real rate of return from holding cash. The merger announcement from Barrick Gold for Randgold Resources and one by Newmont for Goldcorp sparked a growing interest in the gold miners.
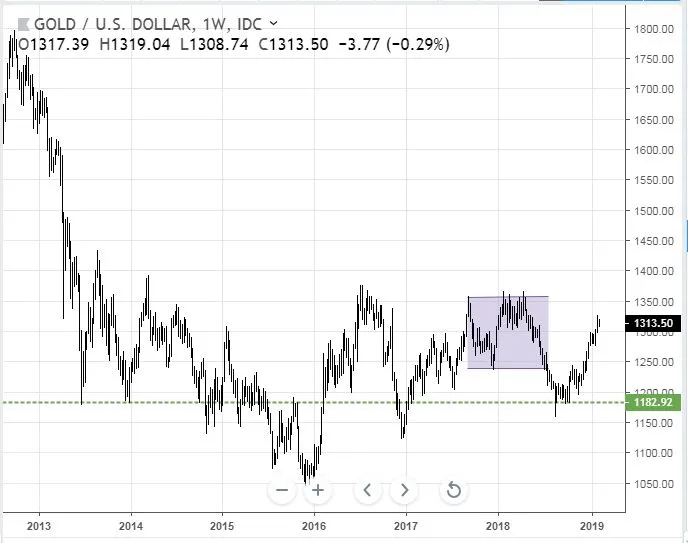
The price chart for Gold is hardly encouraging.
- Yes: Price has jumped off the 2018 lows
- Yes: Price has made a second higher low in a row from the 2015 lows.
- No: Price has been in the same trading range between $1184 and $1350 for 3 whole years.
That makes it hard to build a compelling case for investing directly in gold (other than as a pure set-and-forget hedging trade). The chart has the parallel channel I drew the last time I made a gold related trade (see TIB257). Sadly price did not reverse when I expected BUT it did reverse. More on gold later.
Sold
Aphria Inc. (APHA.TO): Medicinal Marijuana. Sold half my holdings for 18% blended profits since May-July 2018. This is consistent with my normal approach of selling out in the face of corporate actions. I will hold the other half as I fully expect Aphria to be taken over by someone who joins the bidding war.
Big lesson learned some time back in new fields like this - diversify your investments and bank your profits along the way. I was challenged to know where to deploy the profits - one chart to guide is a relative chart of Aphria (black bars) against the industry players.
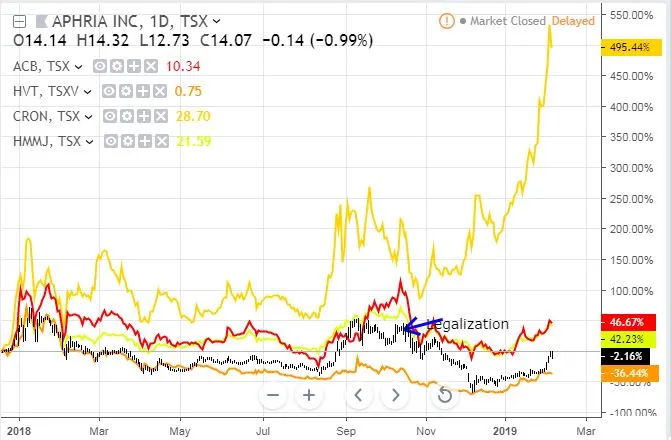
From the bottom, Aphria and Harvest One (HVT.V - orange line) have lagged the industry. Next line up is Aurora Cannabis (ACB.TO - red line) and the Industry ETF (HMMJ.TO - yellow line). Top line is Cronos (CRON.TO - ochre line) which is a clear leader on this timescale. The big lesson here is Cronos has already inked its big deal with Altria (MO), the tobacco giant.
Bought
I chose to deploy the Aphria profits in the stock I bought last week (Namaste Technologies) and Aurora Cannabis as it is representative of the industry and has plenty of upside if it is to close even one third of the gap to Cronos.
Namaste Technologies Inc (N.V): Canadian Marijuana. With the news breaking this week of the sacking of the CEO knocking share price back 21%, I averaged down my entry price by adding another small parcel of stock. The market tends to overreact to this type of news. Now it is a challenge for a smallish startup business to prosper with a change of CEO. My sense is this industry is ripe for acquisitions - somebody will snap up these assets if the strategic review does decide on a sale.
Aurora Cannabis Inc (ACB.TO): Canadian Marijuana. I deployed the profits from the Aphria trade into a small holding in Aurora Cannabis
Gold Mining*
Building on the gold idea. Gold miners are highly leveraged to a rising gold price BUT they typically lag the uptick in the gold price. Given I felt it was hard to build a compelling case for investing in gold, was there a case for Gold Miners? The key chart to understand is the buy:sell chart between Gold (using SPDR Gold ETF) and Gold Miners (using Van Eck Vectors Gold Miners ETF (GDX). I have set this out for 3 years to capture the last time GDX was outperforming Gold (2016). The chart shows quite clearly a very sideways story from Q4 2016 until Q4 2018 and then GDX has turned over and has started outperforming and made a lower low and a few lower highs.
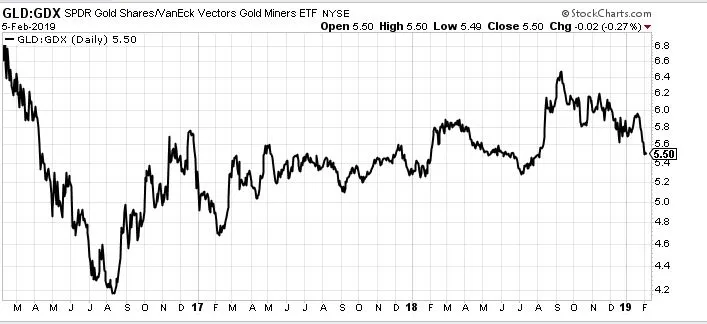
Buy:Sell Chart [Means: Buy the first named stock and sell the second named stock. If the chart goes up the first named stock is outperforming. If the chart goes down the second named stock is outperforming]
I chose two ways of playing the gold miner trades going back to trades I made before.
Yamana Gold Inc (AUY): Gold Miner. Bought Jan 2021 2.5/4 bull call spread for $0.49 net premium offering maximum profit potential of 206%. With closing price of $2.81 this spread is already $0.31 in-the-money. I bought this spread rather than a 3/5 (net premium $0.44) as I am already holding it in this portfolio and I felt that the stretch to get to $5 is too far. The 3/5 spread offers a 354% maximum profit potential - feels like a good trade.
Let's look at the updated chart which shows the bought call (2.5) as a blue ray and the sold call (4) as a red ray with the expiry date the dotted green line on the right margin.
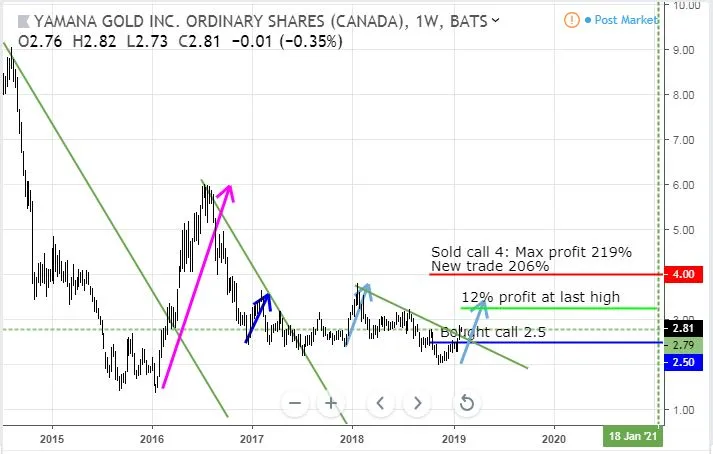
I have moved the light blue arrow to the current zone as that is a more likely price scenario. This is why I was not comfortable with selling the 5 strike calls. I have put in a green ray which coincides with the last high at $3.25 - that offers 12% profit on the new trade. What the trade really needs is a pink arrow scenario. That is very possible as price has made a new high and broken the last downtrend line. (See TIB 307 for the original trade)
VanEck Vectors Gold Miners ETF (GDX): Gold Mining. Bought Jan 2021 23/28 bull call spread for $1.61 net premium offering maximum profit potential of 164%. I would have liked a wider spread but 28 strike was the highest I could go for the sold strike. The Yamana trade looks better [and it is smaller].
I have updated the chart with the new trade (in pastel colours) and the new expiry.
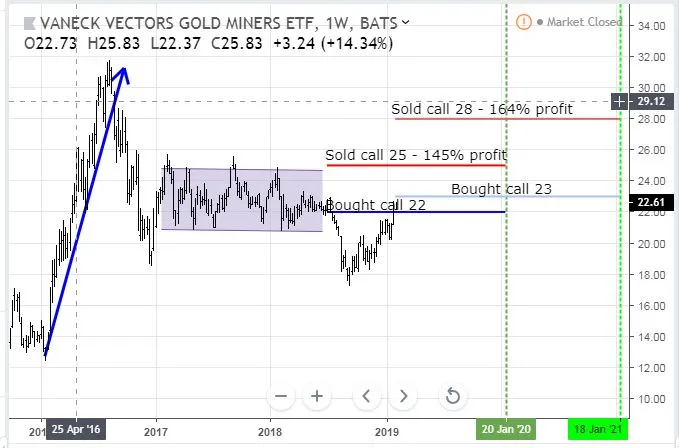
My earlier trade stills looks possible if price can make it to the top of the range inthe next 11 months. The new trade is going to need something a bit more like the blue arrow price scenario to be a winner. But the price target is below the 2016 highs.
56 Percent Club Update
56 Percent Club idea was started by a friend who asked what has done 56 percent in the last 12 months. Each month, I review all my portfolios and tabulate the 56 percent movers from all time and highlighting the ones from the last 12 months. I review stocks and options separately.
First is the table of stocks. I have highlighted ones that are new to the club in Yellow. For stocks returning to the list I have labelled them Back rather than New. I have also marked up whether they have gone up or down since last time.
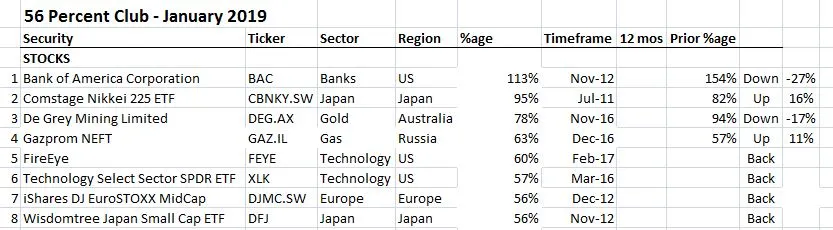
What stands out?
- 4 stocks that fell off the list in the selloff came back to make a longer list (8 vs 5). One sale of Wells Fargo (WFC)
- Bank of America (BAC) retains its top slot but is the biggest faller at 27% down for the month
- Return to the list for 4 stocks in Cybersecurity, Europe, Technology and Japan.
- Biggest riser was Japan helped by a slide in Japanese Yen
- None of the stocks were bought in the last 12 months
- Missing from the data is Canadian marijuana producer, Aphria (APHA.TO) for which some of my holdings have gone over 56% but not on average for the whole portfolio.
On the options side same deal with Shorts marked in red text - i.e., for trades where I am expecting the market to go down. I have highlighted ones that are new to the club in Yellow.
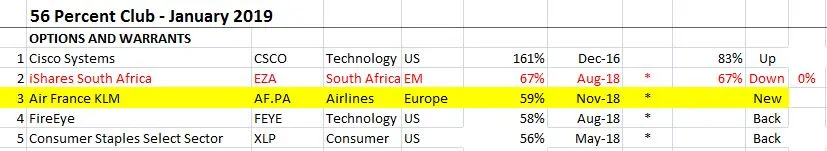
What stands out?
- Selloff continued to be felt with a shorter list (5 vs 6) with two sales.
- There is a new leader in Cisco Systems (CSCO) replacing one month wonder Direxxion Short Real Estate ETF (DRV). Cisco more than recovered its December loss going up 95%
- New to the list is quite surprising, Air France KLM, the French/Dutch airline.
- Back on the list are Cybersecurity and US Consumer Staples.
- Dropped off the list are the Short US Real Estate ETF (DRV) and US Retail (XRT)
- Sold are Swiss pharmaceutical giant, Novartis and Eurodollar puts.
- 4 out of 5 positions were bought in the last 12 months.
Cryptocurency
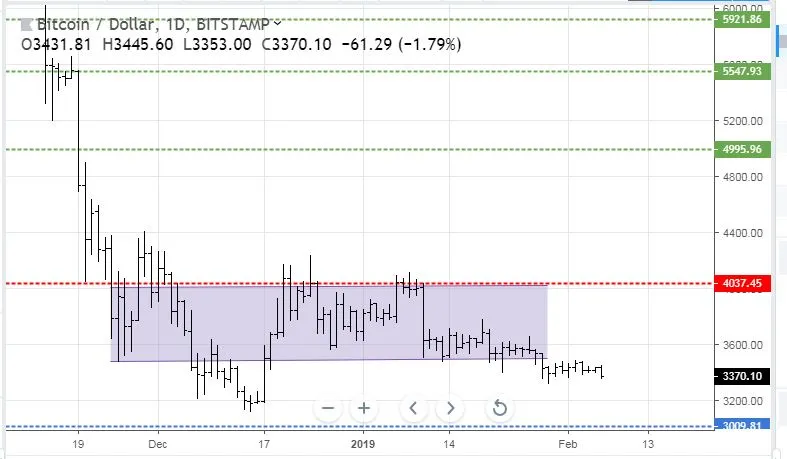
Bitcoin (BTCUSD): Price range for the day was $39 (1.1% of the high). Price did nothing during the day - I did write yesterday that it feels like it wants to go down. I had only to wait a day with volatility nearly 3 times higher today already.
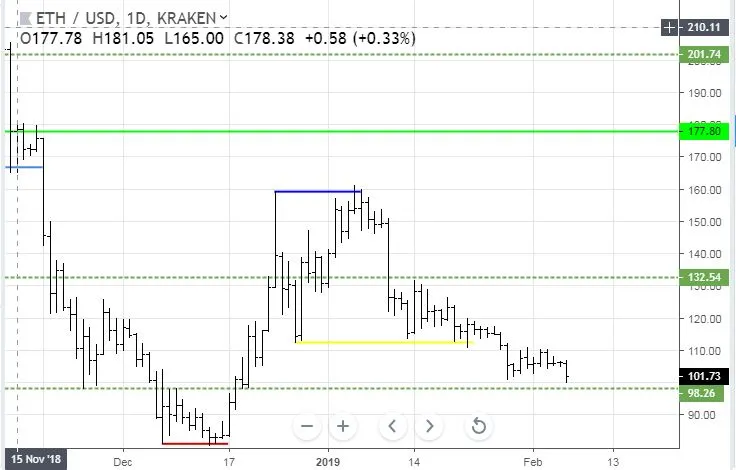
Ethereum (ETHUSD): Price range for the day was $2 (2% of the high). Price also did nothing and waited for today to head down to test the support at $98 - traders do not like "no mans land"
CryptoBots
Outsourced Bot No more updates
Profit Trailer Bot No closed trades
New Trading Bot Trading out using Crypto Prophecy. No closed trades
Currency Trades
Outsourced MAM account Actions to Wealth closed out 2 trades for 0.11% profits for the day.
Cautions: This is not financial advice. You need to consider your own financial position and take your own advice before you follow any of my ideas
Images: I own the rights to use and edit the Buy Sell image. News headlines come from Google Search and Bloomberg.com. All other images are created using my various trading and charting platforms. They are all my own work
Tickers: I monitor my portfolios using Yahoo Finance. The ticker symbols used are Yahoo Finance tickers
Charts: http://mymark.mx/TradingView - this is a free charting package. I have a Pro subscription to get access to real time forex prices
February 5, 2019