Bitcoin climbs off the floor. US markets seem to too. I am looking for under-valued situations and adding protections. Out go some more technology stocks. In comes more financials and more gold and new entrants in packaged goods and US pharmaceuticals. Always find place for interest rate plays when I have margin in an account.

Portfolio News
Market Jitters - Tariff Tantrum US markets did the flip flop in Monday trading after a tricky start.
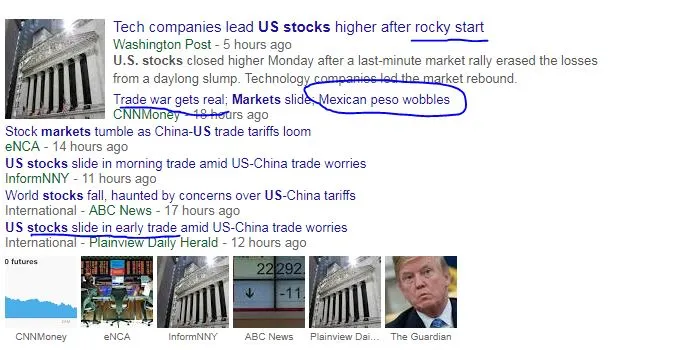
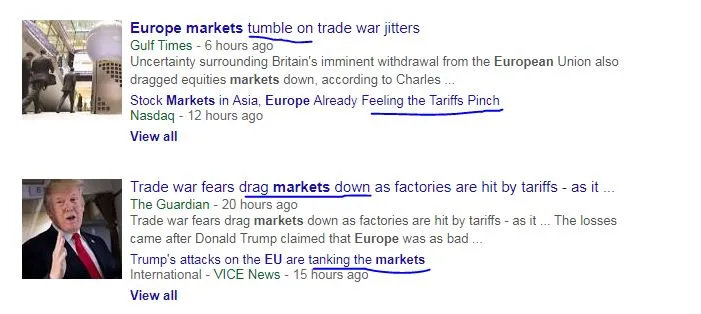
The real pain was felt in Asia and Europe who are the big losers if the tariff tantrum boils over to a trade war.
It is hard to work out what the real drivers are. There is no doubt that there is a lot of fear. There are calculations that can be made for the tariffs that are in place and for the ones that will come into effect on July 6. What is much harder to get to the bottom of is what really is going on in China. What is going on in the Chinese debt explosion? How safe is it really to invest in China stocks? Maybe the rabbit is out the bag and it is not a rabbit out of the hat like it was in 2015. There are some solid clues in this article which digs into why China A Shares have not improved after the addition with a 5% weighting to the MSCI index. It is a good thing they did not do the full 18% warranted by market size.
https://asia.nikkei.com/Opinion/The-fears-haunting-China-s-markets
World Cup The Russia headlines for the last 24 hours are all about football.

No surprise there as Russia down Spain, against the odds. Crowd support was amazing and Spain have never won a competition knockout game against a host nation. England fans put away their media-fed fears and arrive in Moscow for the next round game that England play against Colombia.

And the Monday action sees a fine theatrical display from Neymar and a Mexican team that did its best to emulate the new Mexican President and win. I started watching the replay of the 2nd half just as the Neymar incident had happened. The man is a cheat - simple. Heartbreak for Japan giving up a 2 goal lead to lose.
Bought
Weekend time is ideas review time - ideas from Real Vision mostly. With US markets reaching high valuations it is becoming harder to find stock picks from following momentum. It is time to start digging looking for gems and for traces of relative value gaps and also to build protections.
Financial Select Sector SPDR ETF (XLF): US Financials. The tariff debate has had a flow through to financials stocks because of changed interest rate expectations. Prices for this ETF are down 12% year to date and all that has changed is market sentiment. The last interview I heard from Jay Powell, Governor of the Federal Reserve indicated that he was pretty clear that rates would continue on the path he was projecting (i.e, 4 in 2018 and 3 in 2019). A daily price chart shows a set of lower highs and price bouncing stubbornly off a solid resistance line (dotted red line drawn through daily closes, not lows) which coincides with a 50% retracement on a Fibonacci retracement.
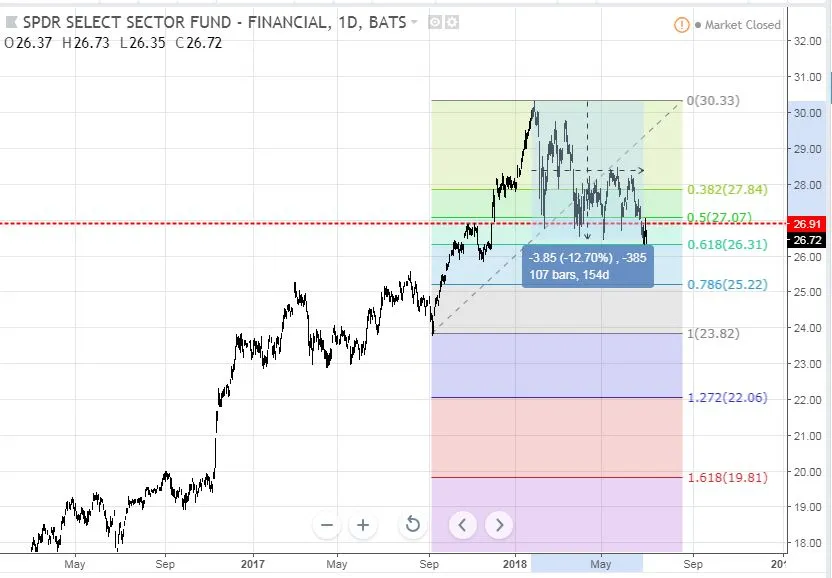
My sense is that once we get back to earnings season the data will begin to talk and dominate the sentiment and we could see price back at 2018 highs in 2018. I bought a January 2020 strike 28 call option for a $1.98 premium (7.4% of Friday close of $26.59) - went two strikes out-the-money to keep trade in limits for this portfolio. To make 100% profit price needs to extend the run from those highs to make a new high in 2019 around $32. All it needs is a run like the one after the 2017 consolidation up to the 2018 high.
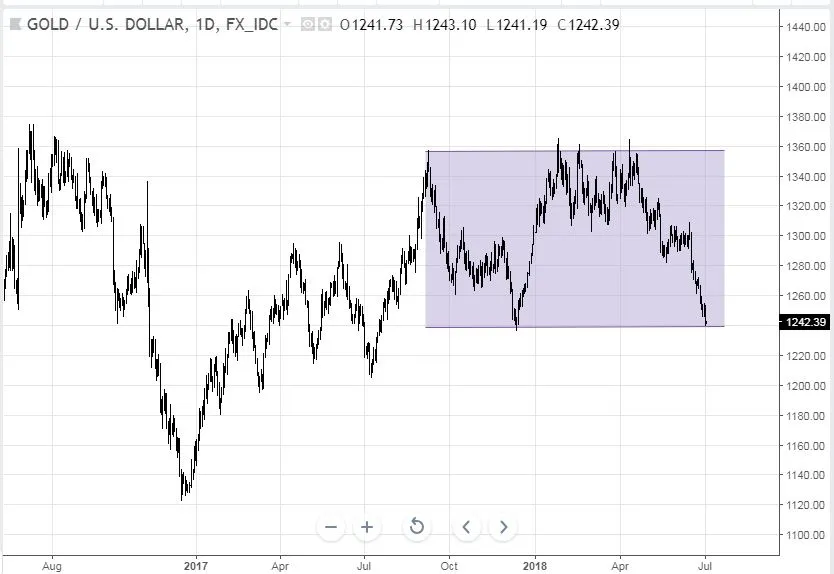
VanEck Vectors Gold Miners ETF (GDX): Gold Miners. A Real Vision idea. Gold has been trading in a range just over $100 wide since September 2017 and is currently testing the prior lows on the back of US Dollar strength. The trade idea is a hedge trade to protect portfolios in the event that the trade debate blows out into a wider trade war and begins to hurt economic growth. It is also a trade looking for the potential for US Dollar to weaken. I did write last week that I would be looking for signs of the reversal in the US Dollar trade - so this trade is a bit inconsistent. An options trade with 18 months to run gives me enough time to get past the US Dollar strength.
There are a few ways to trade gold. I looked at options on the SPDR Gold Shares ETF (GLD) and also at options on the Van Eck Vectors Gold Miners ETF (GDX). The gold miners do not trade directly in line with the gold price as there is a lag in production levels and they are sensitive to interest rates to cover financing costs. GLD trades at $117 and GDX at $22, which means one can get exposure to gold through GDX for as little as $200 per contract. I did compare bull call spreads on both and chose GDX as I could get a higher profit potential for the same movement and at smaller contract size. I bought a January 2020 22/25 bull call spread and am looking for a 10% move in price - i.e., gold going back to the top of its trading range.
Bull call spread [Means: Bought strike 22 call options and sold strike 25 call options with the same expiry]. I paid a $1.22 net premium compared to closing price of $22.31 (5.5% of strike). This gives maximum profit potential of 145% which feels right for a hedging trade. The chart looks easy - it shows the bought call (22) as a blue ray and the sold call (25) as a red ray with the expiry date the dotted green line on the right margin
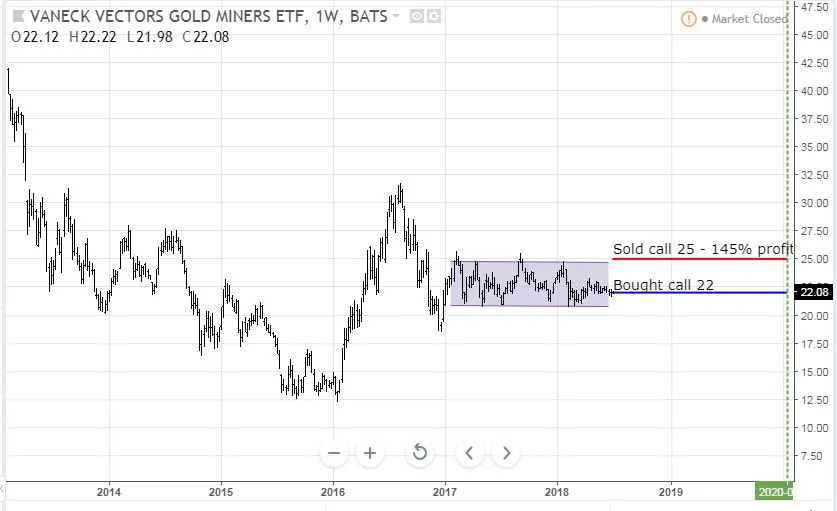
All price has to do is go back to the top of the channel it has been trading in for the last 18 months. What is the risk in the trade? The good news is that anything that really ramps up market fear will make gold go up. A dramatic rise in US interest rates should drive fear but it could also dramatically increase the US Dollar which is bad for gold and high rates are bad for gold miners that have high debt. The biggest risk is that it takes longer than 18 months.
I am already exposed in my portfolios to a bigger move in the gold price - i.e., open ended.
AT&T Inc (T): US Telecom. A Real Vision idea. The court approval of the AT&T acquisition of Time Warner has changed the dynamics of the networks and broadcasting and telecoms industry. Directly after the deal was approved, AT&T bought an ad service technology business, AppNexus. This is the second such purchase they have made since announcing their bid for Time Warner.
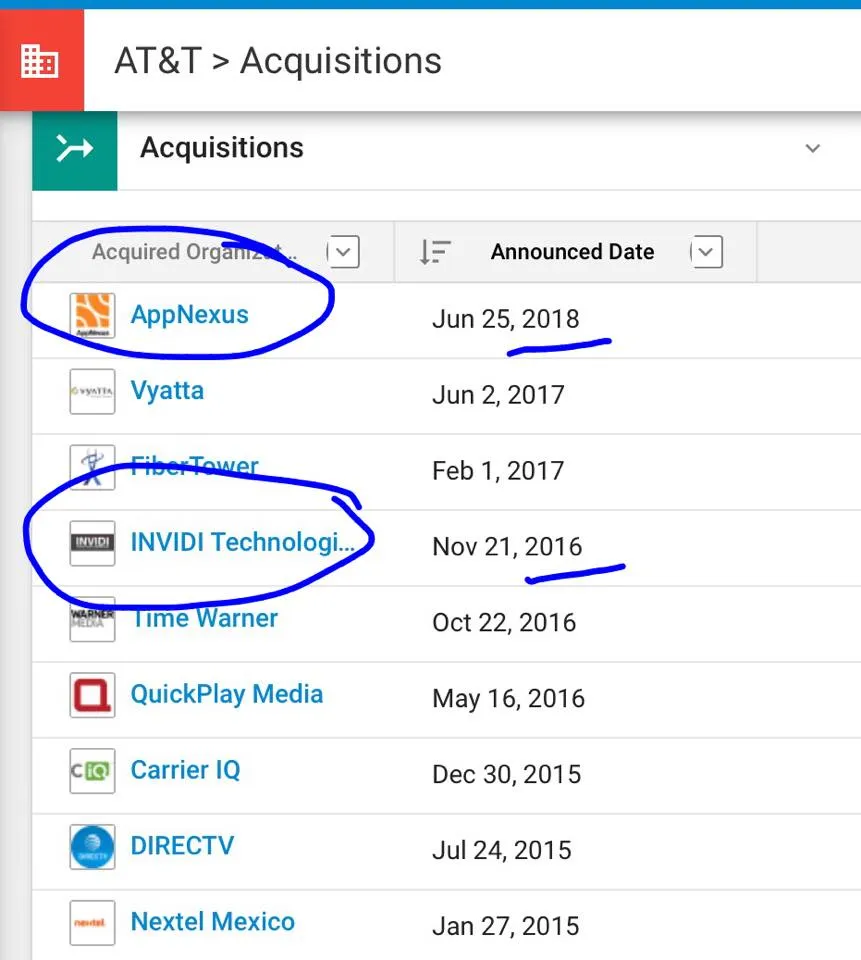
https://www.crunchbase.com/organization/at-t/acquisitions/acquisitions_list
The trade idea is that AT&T can now position themselves as a viable competitor in advertising to Facebook and Global. They have the customers. They now have the content. All they need is the technology to identify needs and deliver advertising. This will take time and the interviewer was looking for a 30% to 40% uplift for AT&T over the next 18 months. Options cover the timeframe and I bought January 2020 33/42 bull call spread for net premium of $1.90 looking for 30 to 40% movement in price in next 18 months.
How does this look on the charts which shows the bought call (33) and halfway mark as blue rays and the sold call (42) as a red ray with the expiry date the dotted green line on the right margin?
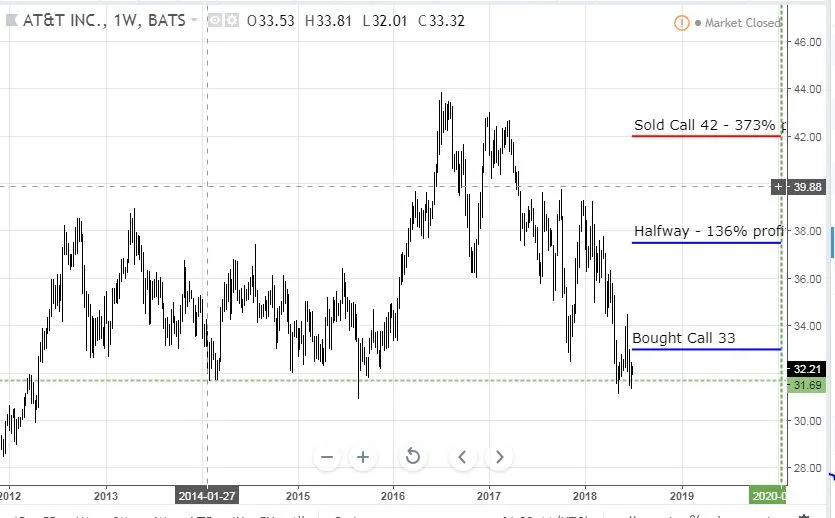
Price has reached a support level which has been tested several times since 2014 - i.e., before the Time Warner bid which was 2 years ago. The maximum profit potential of 373% is below the 2016 highs. The halfway mark is level with the highs reached in 2013 through to 2015. It all looks attainable. There are risks in the trade. Can management execute? After all, they are an old line telecom company competing with the brilliance of Facebook and Google. Will the regulatory playing field remain friendly? AT&T will be loading up with debt to fund Time Warner acquisition. Can they sustain earnings with higher debt and higher interest rates? Can they pull this off in 18 months? A straight stock purchase reduces that risk and it also offers a 6.23% dividend yield (though that is at risk if rates rise hard). I will review that as an idea as time unfolds.
SPDR S&P Pharmaceuticals ETF (XPH): US Pharmaceuticals. A Real Vision idea looking for relative underperformance. The healthcare sector has lagged the S&P500 over the last 3 years (essentially since Donald Trump came to the fore in the US Election - easily seen in the buy:sell chart plotting S&P500 compared to Health Care Select Sector SPDR ETF (XLV)).
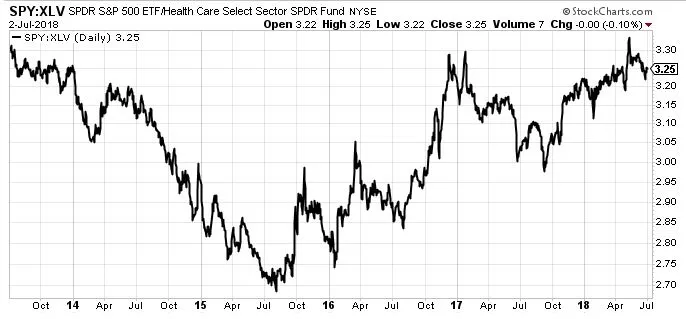
The trade idea is simple - buy the healthcare sector and wait for ageing demographics to work their way through the numbers. If this chart gets back to the bottom compared to S&P500, that is a 20% improvement. I dug a little deeper. XLV is a markett capitalisation weighted ETF that includes a mix of healthcare providers (like UNH), pharmaceutical companies (like PFE and MRK) and industry suppliers (like JNJ and TMO). The next buy:sell chart shows S&P500 compared to SPDR S&P Pharmaceuticals ETF (XPH).
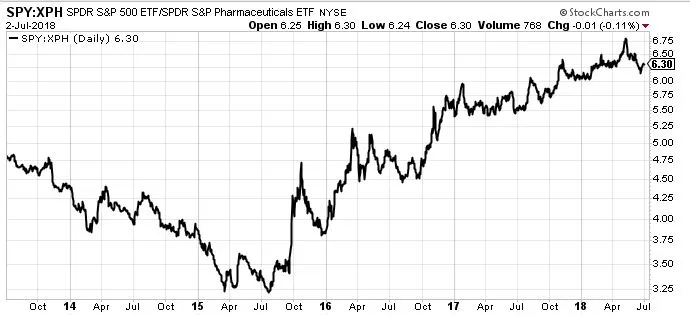
The chart looks much the same until you study the numbers on the right hand axis. SPY has gone from 3.25 to 6.30 - almost double. Get half way down the chart for a 30% improvement. That got me interested in pharmaceuticals as a sector. The last buy:sell chart puts XLV and XPH together.
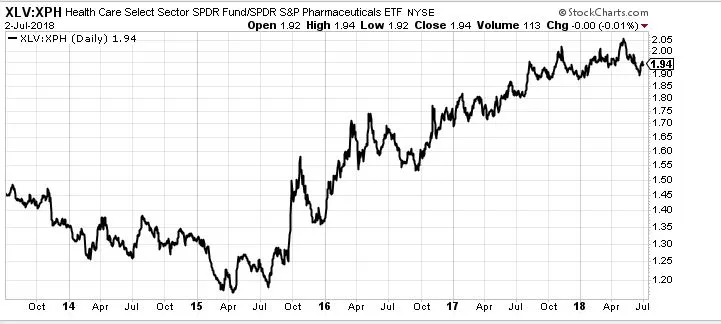
XPH has underperformed the broader sector since 2015 and has turned over and made a lower low. I added a small parcel in one of my portfolios from the proceeds of the VMware sale = a rotation out of high growth technology sector to a lagging healthcare sector.
Now there is some risk in this trade if and when Donald Trump comes back to campaign promises. I am figuring that the ageing population demographic will outlast him - I bought stock.
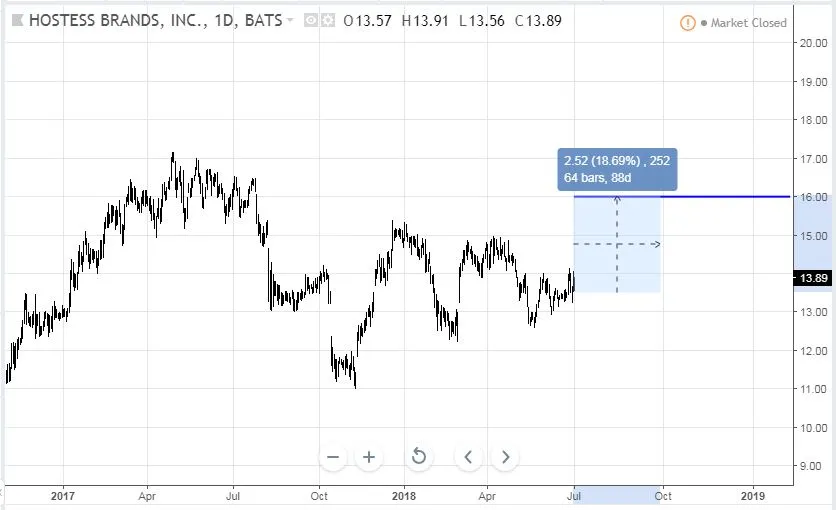
Hostess Brands, Inc (TWNK): US Packaged Goods. Real Vision idea. Hostess Brands develops, manufactures, markets, sells, and distributes fresh sweet baked goods in the United States. Its leading brand is Twinkies.

By Klewis1951 [CC BY-SA 4.0 (https://creativecommons.org/licenses/by-sa/4.0)], from Wikimedia Commons
This idea came up as the business emerged from Chapter 11 bankruptcy in 2016 (used to restructure union contracts) and is now trading back in the middle of its recovery price range. The interviewee was looking for a price target of $16 (18%) to $22 (60%) for the stock on the back of a well branded product reputation.
I have had great success trading warrants in stocks emerging from bankruptcy. Hostess Brands did issue warrants as part of the restructuring. These are 4 years to expiry warrants which are exercisable if price exceeds $24 in November 2021 and have an $11.5 strike and require 2 warrants per share. Now it might be a stretch to think that price will reach $24 given that the highs since the restructuring are only $17. It is the price behaviour of the warrants if price reaches the first target of $16 that interests me. The next chart lays the warrants on top of the chart (orange line)
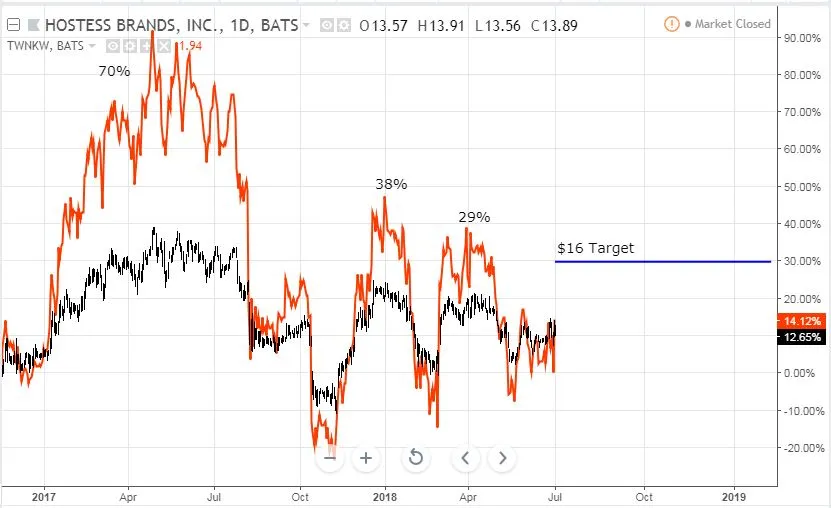
For an 18% rise in price to the $16 target, the warrants have previously shown price increases of 29%, 38% and 70%. Of course if price does reach the stretch target of $22 the returns on the warrants will be more than double these. Now there are risks in the trade. The company sells products that are intrinsically unhealthy to a population that might get switched on to healthier eating. Long term debt to equity is high at 66% though operating margins are solid and interest cover is safe. A further risk is the Metropoulos family that orchestrated the bailout tend not to stay around for the long haul - they could become committed sellers when they choose to exit.
https://www.fooddive.com/news/necco-sells-to-metropoulos-family-entity-for-173m/524869/
Sold
VMware, Inc. (VMW): US Technology. I saw the announcement that Dell was buying out the tracking stock for VMware with a view to using that as the backdoor to relist. Price popped on VMware. I sold my holding for 217% profit since March 2016. A little disappointing to see price add another $6 per share after I closed. I have learned over time that a corporate action like this is a signal to close because the asymmetry of the trade has gone and the action introduces uncertainty with regulations and approvals and legal teams hovering. This trade makes up for losses in VMWare bought before and sold after the GFC. A longer term buy and hold would have worked really well.
Shorts
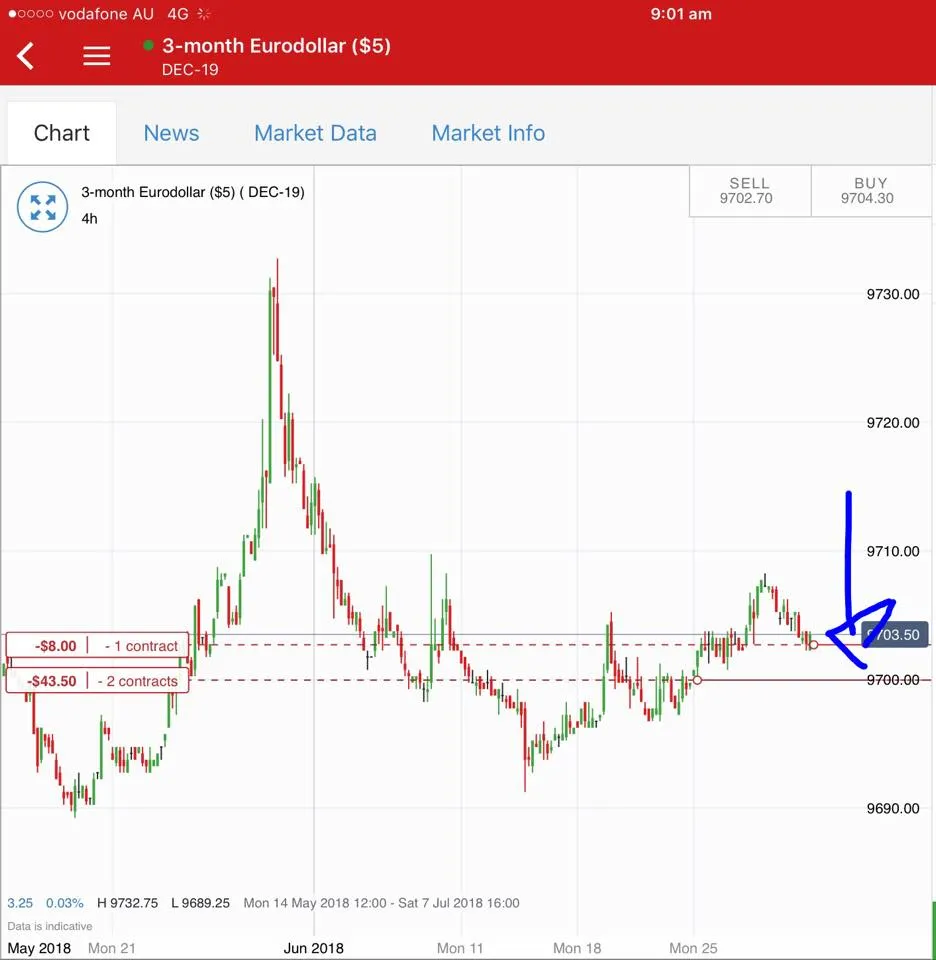
Eurodollar 3 Month Interest Rate Futures (GEZ): Added 2 new contracts short for December 2019 futures at 97.02. Target will be the 96.90 lows.
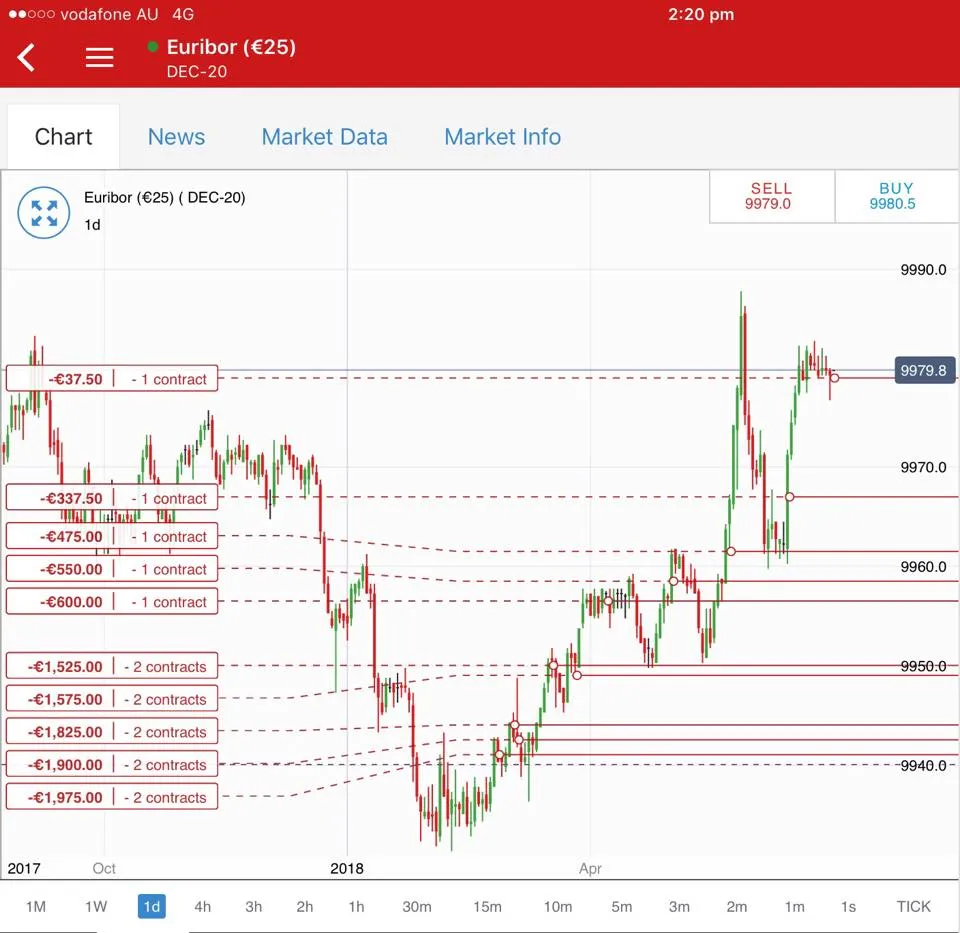
Euribor 3 Month Interest Rate Futures (IZ): Added 2 new contracts short for December 2020 futures at 99.80. With 2 and half years to go I feel sure rates in Europe will be higher than the 0.3% showing here.
Cryptocurency
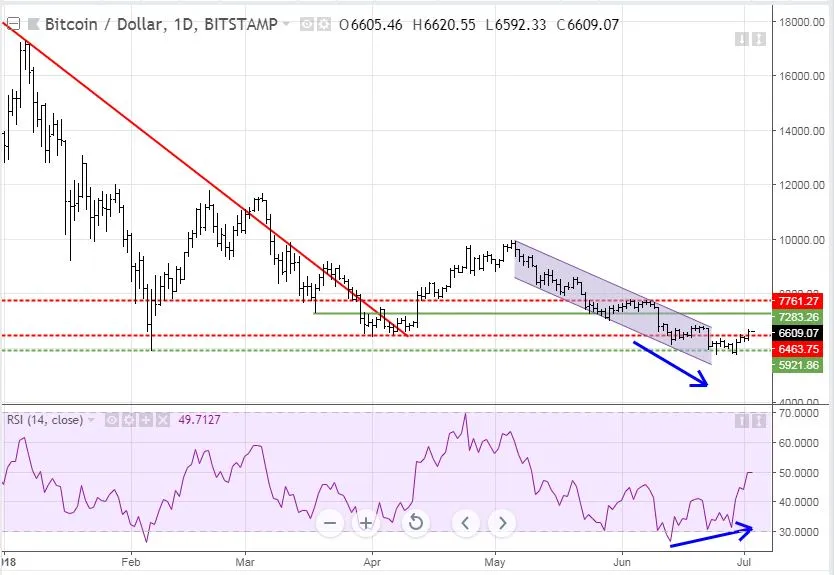
Bitcoin (BTCUSD): Price range for the weekend was $893 (15% of the low). Price tested the February support level twice and broke back up. As intimated the other day, the divergence on the momentum indicator was a good leading indicator with buyers emerging though at modest volumes. The glory days of big price rises seem to be behind us. We can only hope the gory days are too.
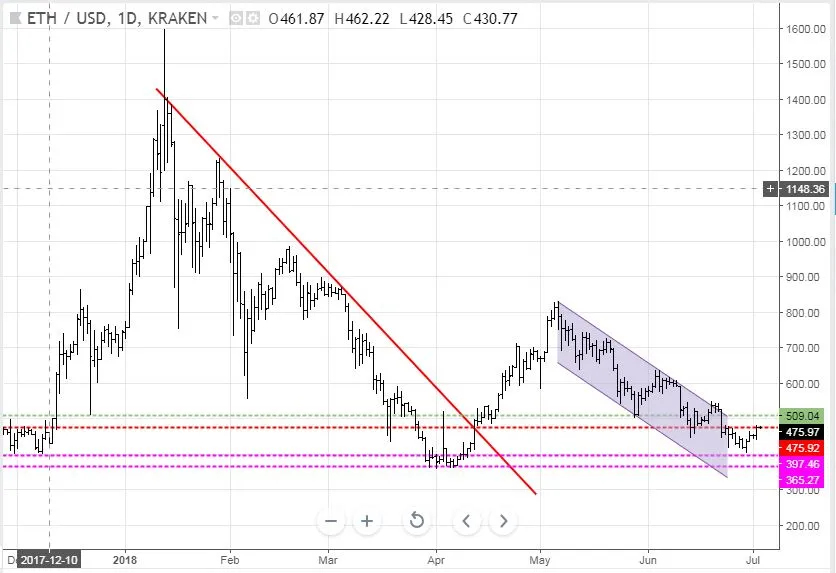
Ethereum (ETHUSD): Price range for the weekend was $78 (19.3% of the low). Price did find its way to the bottom of "no mans land" and bounced off the support level around $400. There is some resistance just above the current level
CryptoBots
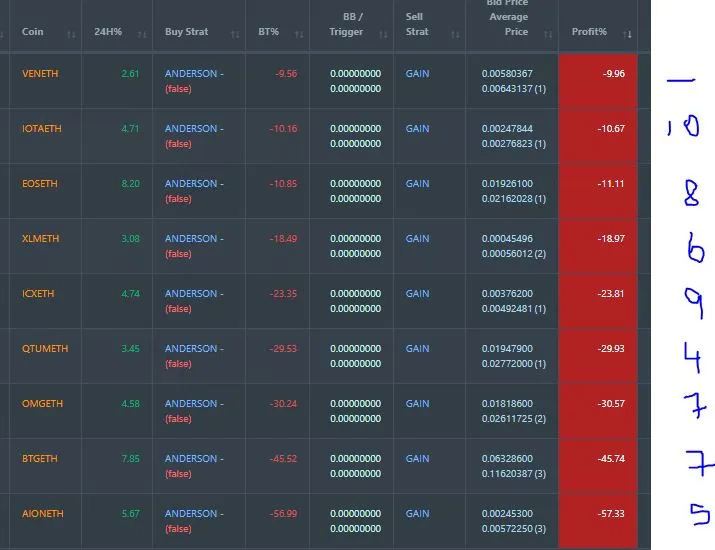
Outsourced Bot No closed trades (212 closed trades). Problem children was unchanged (>10% down) - (18 coins) - ETH, ZEC (-45%), DASH (-49%), LTC, BTS, ICX (-42%), ADA (-41%), PPT (-50%), DGD (-48%), GAS (-64%), SNT, STRAT (-50%), NEO (-58%), ETC, QTUM (-46%), BTG (-60%), XMR, OMG
GAS remains the worst coin at -64% with NEO trying to shake off the 60% down handle.Biggest movers were PPT which well and truly left the 60's to 50% down and ADA which left the 50s to 41% down.
Profit Trailer Bot No closed trades. Dollar Cost Average (DCA) list was unchanged at 12 coins with 11 coins improving, and 1 coin trading flat.
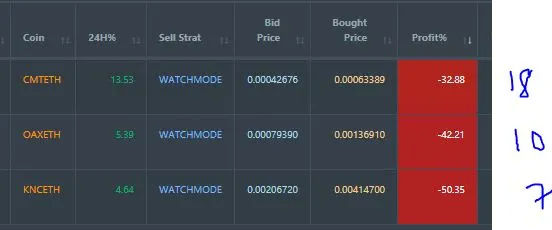
Biggest move was CMT which improved 18 percentage points. It looks like I missed a good point to start the whitelist based trading with all coins moving well ahead apart from VEN.
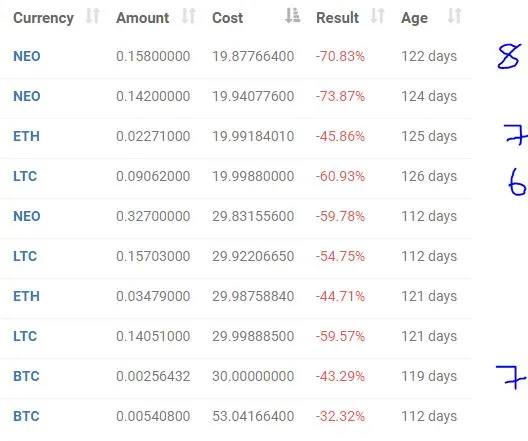
New Trading Bot Positions improved 7 points to -51.6% (was -58.9%) for the best move for some time.
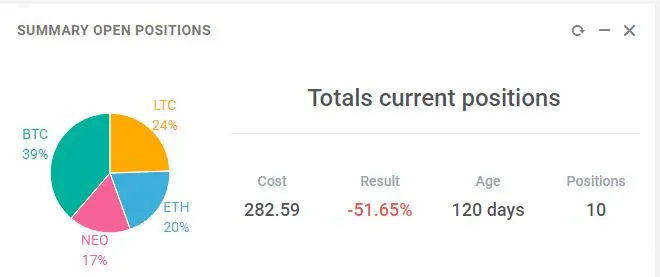
All coins improved at least 6 points with NEO the best at 8.
Currency Trades
Forex Robot closed trades over two trade days - 8 trades (0.31% profit) and 4 trades (0.16%) is trading at a negative equity level of 4.1% (higher than prior day's 2.06%).
Cautions: This is not financial advice. You need to consider your own financial position and take your own advice before you follow any of my ideas
Images: I own the rights to use and edit the Buy Sell image. News headlines come from Google Search. AT&T acquisitions image comes from Crunchbase.com. Twinkies images is credited below it. All other images are created using my various trading and charting platforms. They are all my own work
Tickers: I monitor my portfolios using Yahoo Finance. The ticker symbols used are Yahoo Finance tickers
Charts: http://mymark.mx/TradingView - this is a free charting package. I have a Pro subscription to get access to real time forex prices
Crypto Trading: get 6 months free trades with Bitmex for leveraged crypto trading. http://mymark.mx/Bitmex
Bitcoin: Get started with mining Bitcoin for as little as $25 http://mymark.mx/Galaxy
July 2, 2018