Iran warns of a restart to uranium enrichment. European banks quake as Italy's PM has first day in office. Taking the chance on more upside from Cisco. Looking for a bounce back in US regional banks and US oil. And adding to the shorts on US Real Estate Trusts and hedging with Saudi Arabia

Portfolio News
Uranium Biggest price rises across my portfolios overnight were uranium stocks. Uranium has been beaten up for ages and I was wondering what was going on. The uranium market is basically waiting for Japan to switch its nuclear reactors on and for India to finish its building program. I know in my portfolios, Paladin Resources (PDN.AX) last week put its Langer Heinrich mine in Namibia into care and maintenance. Its Malawian mine is already mothballed. Are there any new buyers? The headlines give some clues.
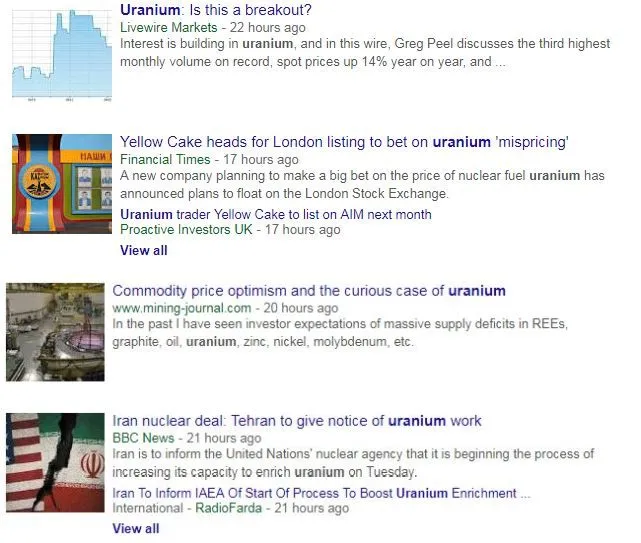
- Yellow Cake are planning a London listing with a vehicle that is looking to buy and sell $250 million worth of uranium.
- More importantly, Iran notified the International Atomic Energy Agency that they had a "tentative schedule to start production of UF6", referring to uranium hexafluoride, the feedstock for centrifuges.
That is a good guess for now. Now the economics of investing in commodities is an interesting topic of understanding supply and demand. Should one invest directly in commodity imbalances (like Yellow Cake) or should one invest in mining suppliers who can step in at the margins when demand rises (like Paladin's mothballed mine) or should one invest for the long haul in greenfield mining and exploration ventures.
This next article presents strong views and argues that uranium may be different to all the other commodity sectors. It ends by saying this
Experts in commodity trading struggle with projecting the future supply-demand situation. Those who are outside the day-to-day action who claim to have a better understanding on future prices of commodities are almost always wrong.
This is a salutary warning for me to review the way I think about resource investing and to take profits when I see them. I would not want to fall into the class of investors that are almost always wrong. Maybe I knew that when I took profits on De Grey Mining (DEG.AX) this week
Europe Muddles The new Italian Prime Minister, Giuseppe Conte, passed his first confidence vote in Parliament.

His maiden speech took aim at migrants, at EU imposed austerity and sanctions against Russia. All of these put Italy at odds with its European allies. He said he wanted to reduce public debt but with a growth model. That can be done but often requires spending first before tax revenues rise. The analysts are clear that there will be a showdown with Europe before too long. How will this unravel? The European Central Bank (ECB) is the largest owner of Italian government bonds. As yields rise, the ECB loses value. The real challenge for Europe is Italy has the most fragile banking sector with the highest proportion of non performing loans that have not been sorted out. Will the uncertainty push any of them over the brink? This will be the key battleground and the contagion risk across other European banks is high. It was no surprise to find that the worst performing stocks in my portfolio were Europe's banks.
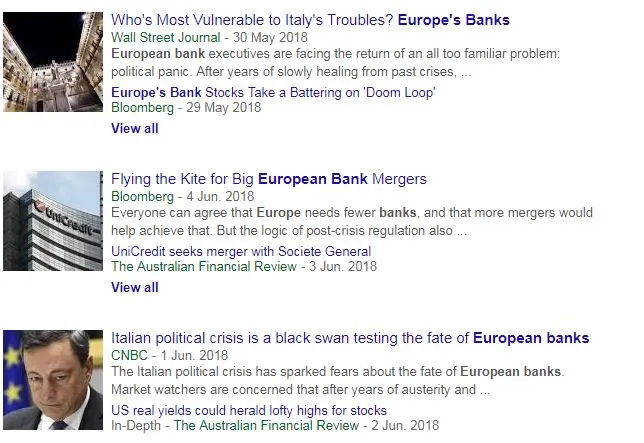
Here is a good review from last week of the black swan risk - i.e., an event like Italy being catastrophic. https://www.cnbc.com/2018/06/01/italian-political-crisis-is-black-swan-testing-fate-of-european-banks.html
Bought
Cisco Systems, Inc (CSCO): US Technology. I took the profits from selling January 2019 strike 35 call options and bought a January 2020 strike 45 call option for a premium of $4.30. This gives a 100% profit target of $53.60. With a closing price of $43.67 this implies a 22% increase in price needed to reach 100% in the next 19 months. This feels like a big stretch and the chart confirms it.
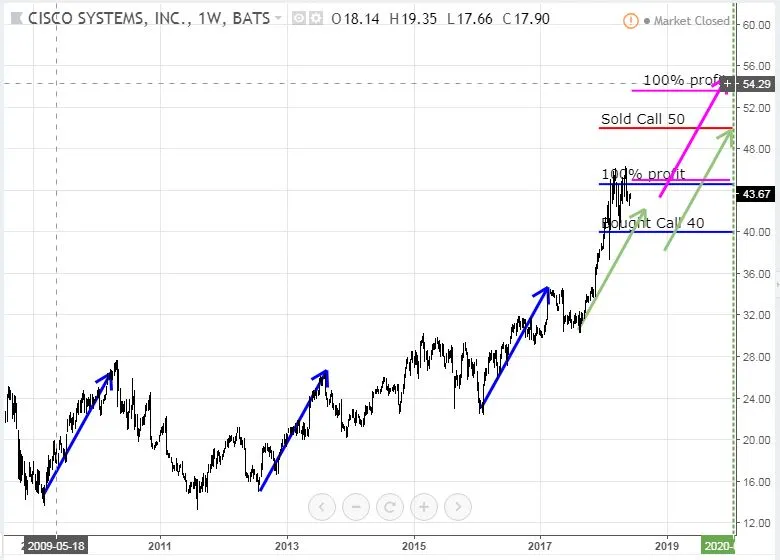
I have overlaid the new trade (pink rays) on the chart for the old 40/50 bull call spread (blue rays) I am holding. The strike price ($45) is below the recent highs and is around the 100% profit level from my prior trade. I had modelled a price scenario (the two green arrows). The good news is price has moved steeper and longer than that scenario which means the right hand arrow could start from a higher point (maybe like the pink arrow). That makes a 100% winner trade.
My sense is the market is now beginning to value the changes that Cisco are making more than they previously did. What has struck me listening to the talking heads is they are no longer viewing technology investments with a 2000 Dot Com crash mentality. They are beginning to believe that technology is in fact a key driver of economic growth. Cisco has to be at the centre of that as its technologies are the heartbeat on the Internet and networking.
There is another way to look at this. I know Cisco has lagged the technology sector but is ahead of the S&P500. Let's see what the chart tells us.
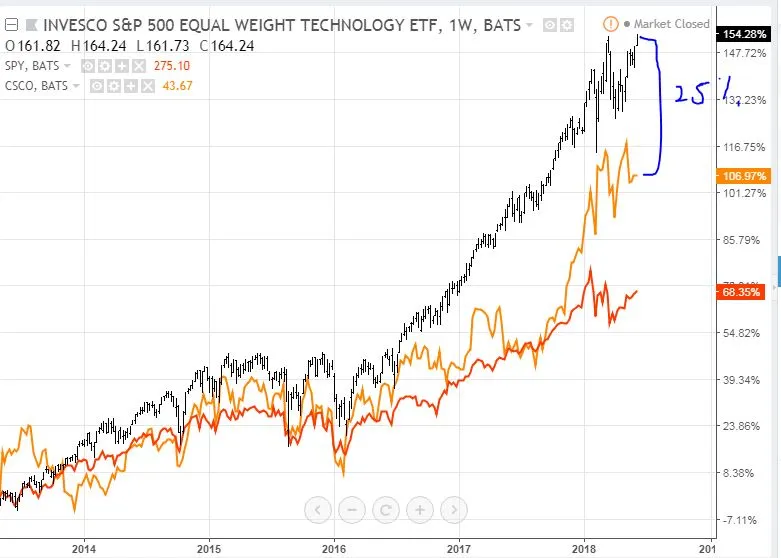
The chart shows the Invesco Equal Weighted Technology ETF (RYT - black bars). I chose this one so it does not get distorted by Apple and Microsoft and Facebook. It represents technology stocks equally. Technology has been a key driver of stock market performance (S&P500 - red line) - 86 percentage points better in fact. Cisco (orange line) is in the middle and has lagged behind but is now growing faster than its sector. The trade needed 22% to get to 100% profit - closing the gap to the sector will deliver more than that.
KeyCorp (KEY): US Regional Bank. Banks stocks have pulled back as longer term yields have softened. My thesis is that the short term interest rate charts are telling us more about what really is going on in the markets. You can see that from yesterday's Eurodollar chart (price chart falls when rates rise)
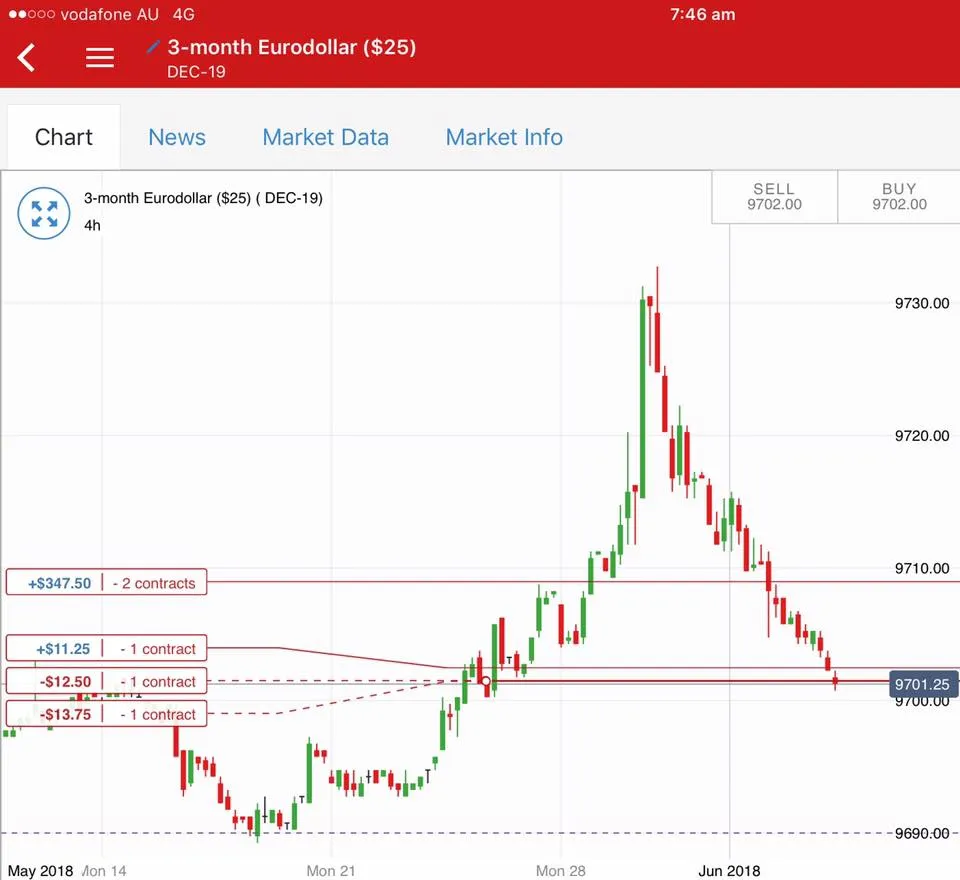
This trade is predicated on the short term rates being the right measure and that bank stocks will grab back what they have given away. I bought a July 2019 strike 20 call option for premium of $0.66. Strike price is just above the closing price of $19.89. The expiry date is after the next Federal Reserve meeting. Let's see what a chart tells us - excuse the mess as the chart also covers part of a longer term trade I am holding.
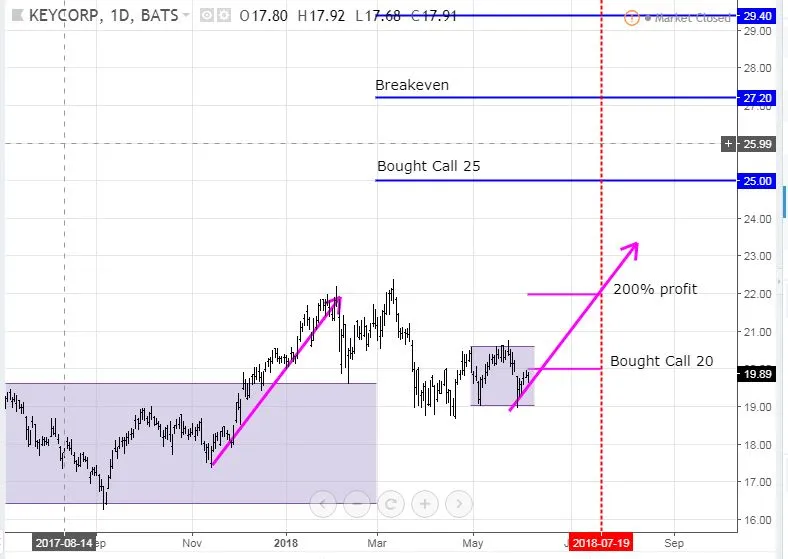
The trade is the bought call 20 (pink rays) and expiry is the dotted red vertical line. Price has been consolidating in a range for the last 6 weeks but it has managed to post higher highs 3 times since the consolidation began. If the Federal Reserve does post a rate hike next meeting and says the right words about the economy, I fully expect price to break out of the consolidation range like it did in November 2017. If it repeats in the same way this trade will comfortably reach the March high which is 200% profit. A more profitable opportunity would be a bull call spread selling a 22 call option. I could not do that in this portfolio.
United States Oil (USO): US Oil. One of the talking heads offered a short term trade idea on US OIL Fund with an October time line. I pushed the timeline a little further out to January 2019 for an extra 6 cents in premium. I was attracted to the trade idea as a little while ago I had put on a trade on SPDR S&P Oil & Gas Exploration & Production ETF (XOP) (see TIB139) and in the discussion someone suggested USO as it has lower implied volatility (26% vs 30%) and it has a lower price which means one can make a small trade more easily. I bought a January 2019 14/16 bull call spread for a net premium of $0.46 = $46 for 100 shares worth. [Means: Bought strike 14 call options and sold strike 16 call options with the same expiry]. What I also liked about the trade setup was the price has been cycling along very tidily making new highs since the 2017 lows. Let's see how it looks on the charts.
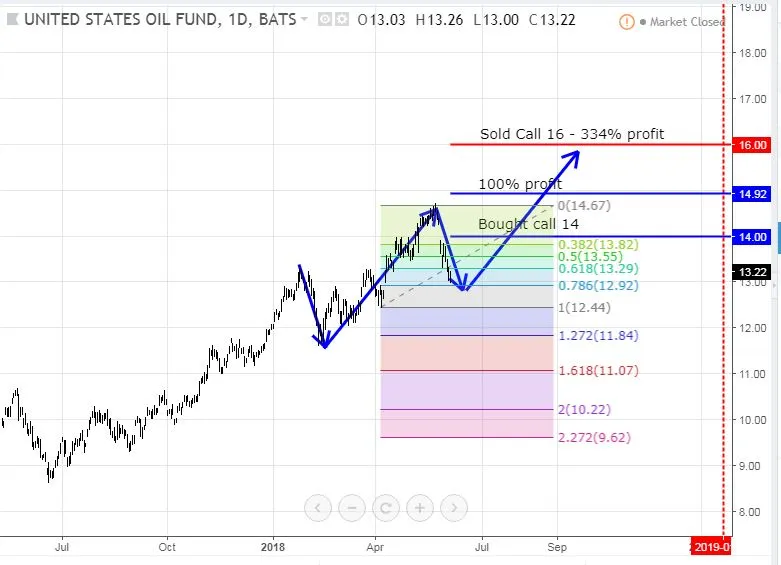
The chart goes back to the last lows in 2017 and shows the bought call and 100% profit as blue rays and the sold call (16) as a red ray with expiry the dotted red line on the right margin. I chose the correction and bounce which had the biggest pullback for my modelling of a price scenario (two left hand blue arrows). That pullback went to the 76.8% Fibonacci retracement level. For that reason, I have modelled a Fibonacci retracement on the current up move and pullback. Price has not quite reached the 76.8% level yet (the point of the short blue arrow shows that). If that level is respected and the bounce is the same intensity as the last one, the trade will get very close to maximum profit of 334%. Peak summer driving season will have come and gone in USA and we could well reach that level before expiry which means an October trade could work well too.
Read this article to understnad how Fibonacci sequences are applied to Technical Analysis.
https://www.investopedia.com/ask/answers/05/fibonacciretracement.asp
iShares MSCI Saudi Arabia ETF (KSA). I wrote about using Saudi Arabia as an uncorrelated trade yesterday (see TIB241). I added it to one of my other portfolios - it is smart to hedge across all portfolios.
Shorts
Direxion 20yr Treasury Bear 3X (DRV): US Real Estate. Short term US interest rates have been going back to where they were a few weeks ago. Longer term interest rates are following behind with something of a lag. I might have been too early on the trade to go short US Real Estate Investment Trusts (REITs) but I had done with a small parcel. I added another position to average down my entry price. (See TIB235 for the rationale on REITs)
Cryptocurency
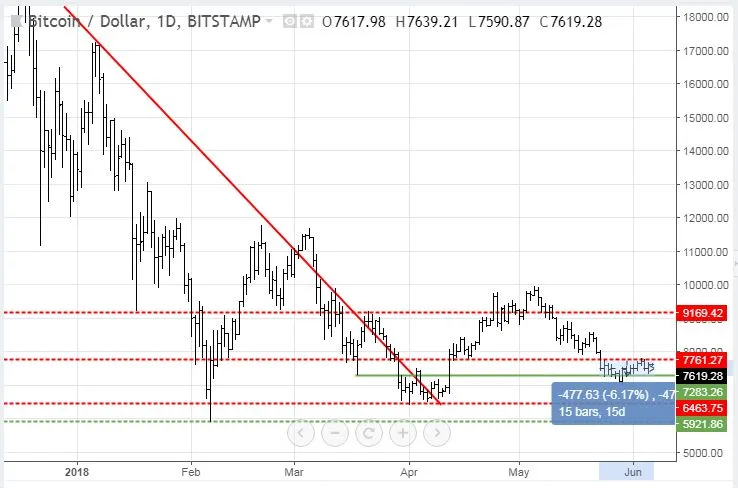
Bitcoin (BTCUSD): Price range for the day was $325 (4.2% of the high) and is sandwiched between two closely spaced support and resistance lines - 6.2% wide.
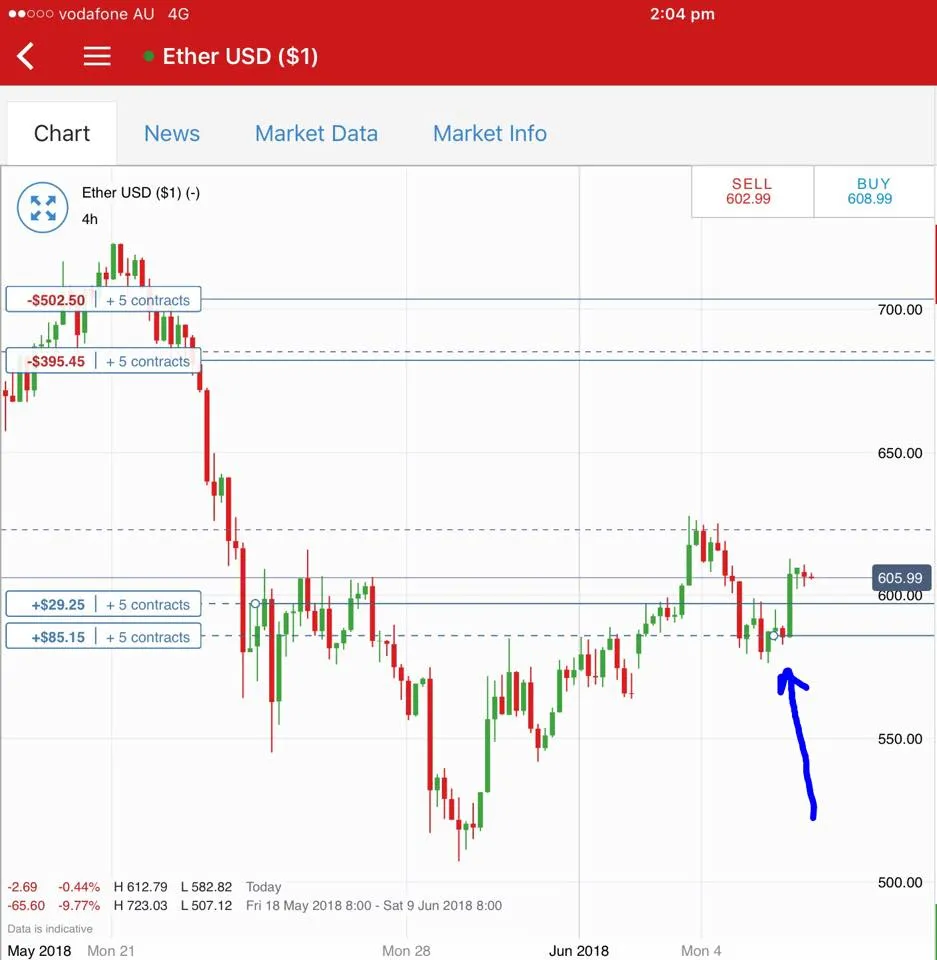
Ethereum (ETHUSD): I added a new Ethereum position when price dropped below my last exit point and made a reversal on a 4 hour chart. The chart is tidily showing higher highs and higher lows on this cycle. Take profit target is set at top of last cycle up (centre dotted line)
CryptoBots
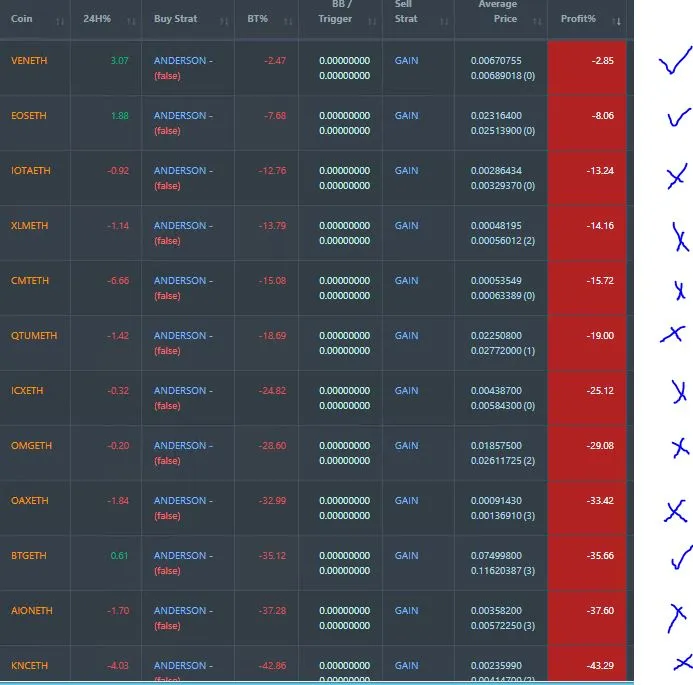
Outsourced Bot No closed trades on this account (212 closed trades). Problem children was unchanged (>10% down) - (14 coins) - ETH, ZEC (-41%), DASH (-44%), ICX, ADA, PPT, DGD, GAS (-48%), STRAT, NEO (-47%), ETC (-43%), QTUM, BTG (-48%), XMR.
GAS joined BTG as the worst at -48%
Profit Trailer Bot No closed trades. Dollar Cost Average (DCA) list remains at 12 coins with 3 coins improving and the other 9 worse.
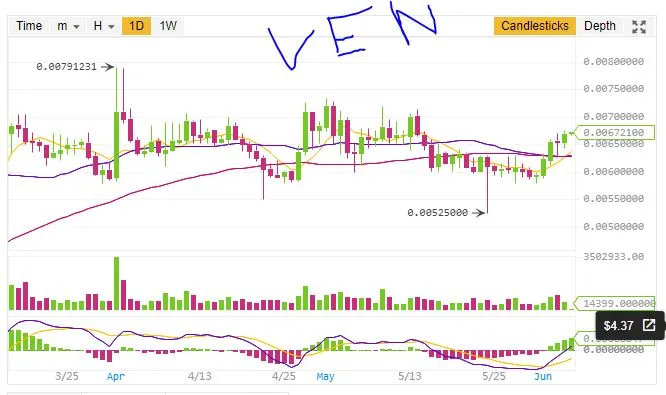
VEN made the strongest move of the day and could well make it off this list. The chart shows an encouraging turn up on modest volumes after a long drift downwards - i.e., not a pump and dump this time.
New Trading Bot Positions improved 1 point to -37.4% (was -38.4%).
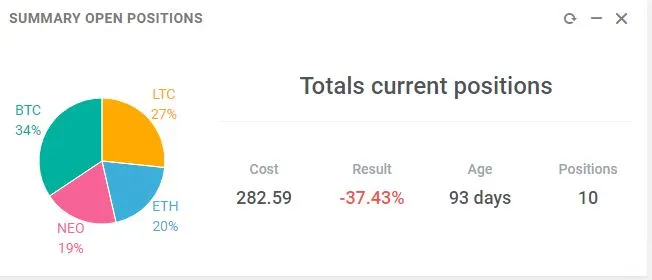
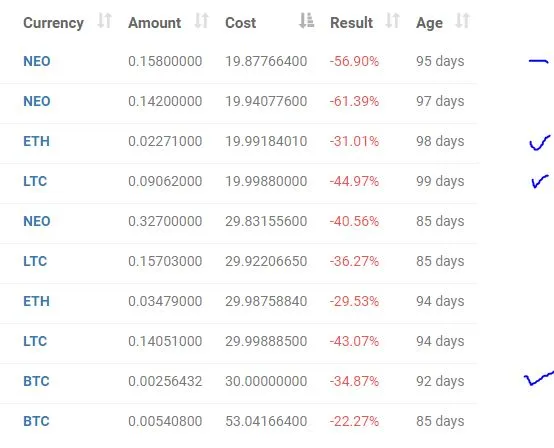
NEO traded flat and ETH, BTC and LTC went up 1 or 2 points.
Currency Trades
Forex Robot did not close any trades and is trading at a negative equity level of 2.6% (higher than prior day's 1.8%). I was surprised to the robot did not close any trades. This is the perfect level to make big closes and start again.
Cautions: This is not financial advice. You need to consider your own financial position and take your own advice before you follow any of my ideas
Images: I own the rights to use and edit the Buy Sell image. News headlines come from Google Search. All other images are created using my various trading and charting platforms. They are all my own work
Tickers: I monitor my portfolios using Yahoo Finance. The ticker symbols used are Yahoo Finance tickers
Charts: http://mymark.mx/TradingView - this is a free charting package. I have a Pro subscription to get access to real time forex prices
Crypto Trading: get 6 months free trades with Bitmex for leveraged crypto trading. http://mymark.mx/Bitmex
Bitcoin: Get started with mining Bitcoin for as little as $25 http://mymark.mx/Galaxy
June 5, 2018