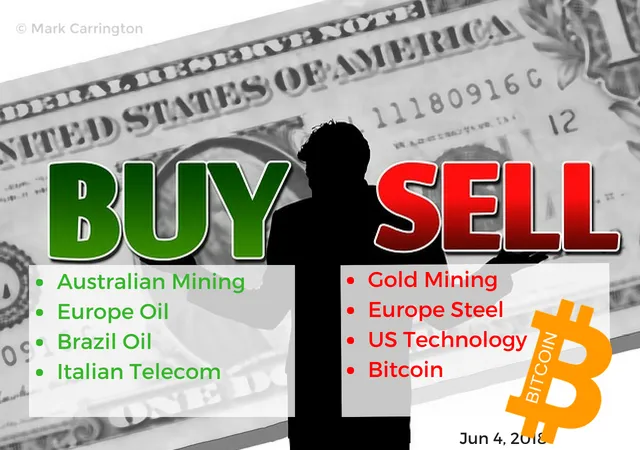
Switching gold amongst Pilbara neighbours. Adding more Saudi Arabia as a hedge trade. Banking oil profits and buying more time. Oil plays are spread across leaders and laggards. Adding more for an Italy bounce.
Portfolio News
Market Jitters Markets went back to the data and looking forward away from their fears.
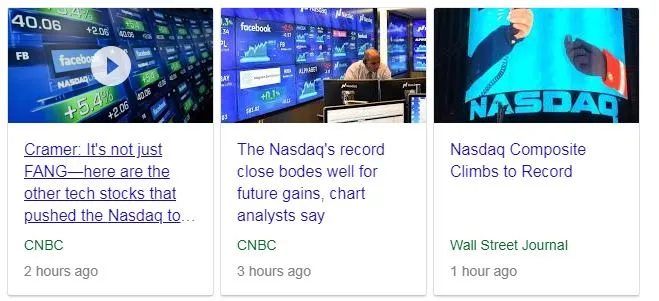
Apple (AAPL) launched its Worldwide Developer Conference with a roadmap for software devlopment. The market liked what it heard and propelled Apple to new highs which dragged Nasdaq to new all time high.
Macys received a strong broker upgrade saying that the "retailpocalypse" was over. This propelled the Retail sector ahead.
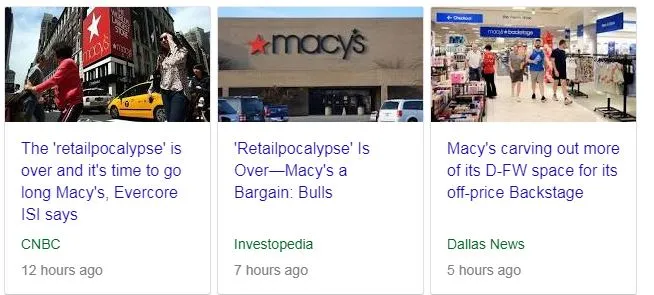
We are convinced that old-world brands and retailers are figuring out how to manage inventory and market to consumers in the digital era, a critical turning point for the sector
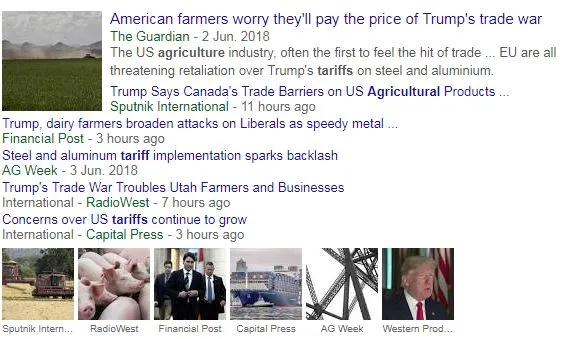
The tariff tantrum seemed to be forgotten even though Donald Trump said that the China negotiations were not heading well and China warned that all trade deals with the US are void if US imposes tariffs.
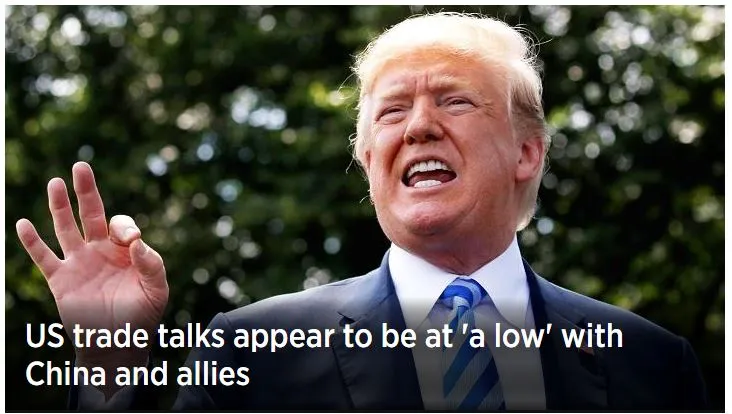
The Canadians and Europeans were very vocal and threatening. Markets do have a short term view and there will be some time before the China tariffs are formulated. Maybe the tariff implementation is too far ahead. One market that did pay attention was agriculture with wheat and sugar prices dropping hard in US markets
Interest rate markets were very clear as Eurodollar short term rates keep on rising
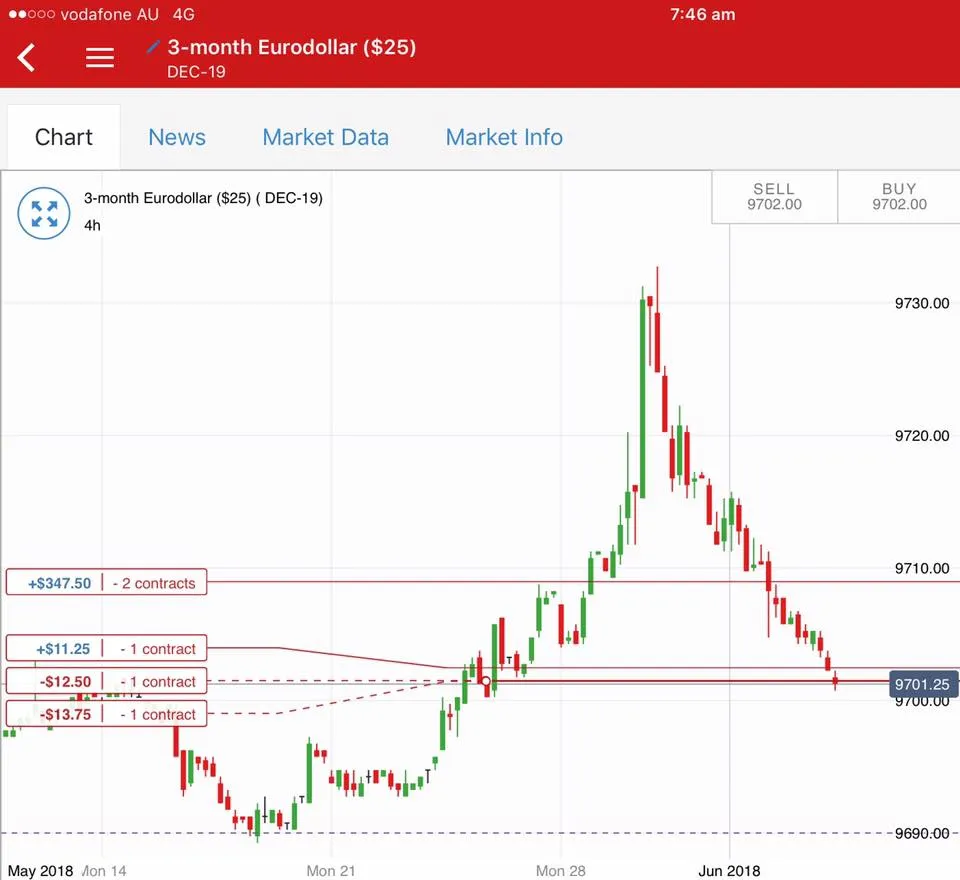
Bought
Kairos Minerals Ltd (KAI.AX): Australian Minerals Explorer. Kairos owns mining tenements in Western Australia covering nickel, cobalt, lithium and gold. My initial purchase was on the back of its nickel holdings at Roe Hills near Kalgoorlie in Western Australia. The company runs with a project mindset always chasing after the next shiny thing (it was originally called Mining Projects Group) which has resulted in a wider project portfolio than nickel and a wider geography than the Roe Hills. One of those excursions has taken them to the Pilbara in northern Western Australia in pursuit initially of lithium but latterly in gold. Its gold tenements are adjacent to the De Grey Mining tenements which have identified significant gold resources.
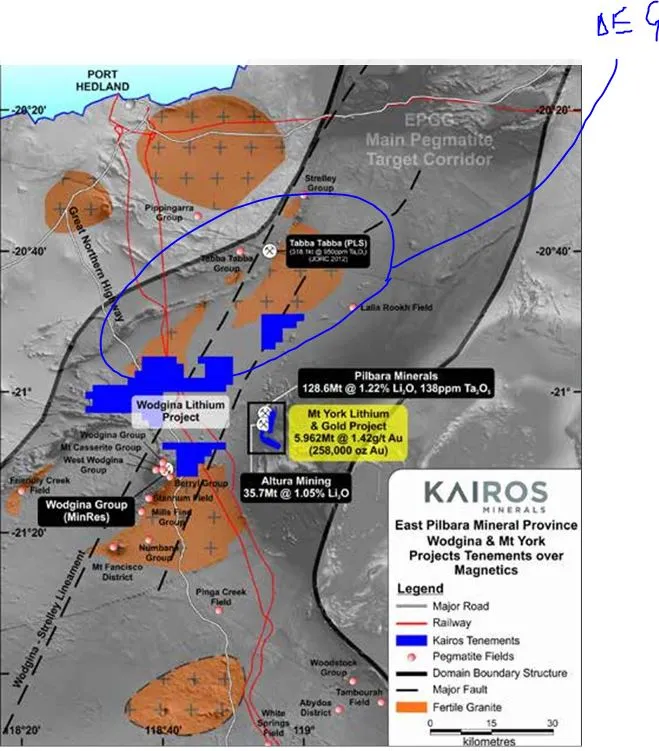
http://www.kairosminerals.com.au/projects/gold/mt-york/
My holdings in De Grey Mining have increased dramatically while Kairos has done very little. I invested the profits from my De Grey holdings into Kairos - I am hoping the gold dust rubs off.
The challenge with this investment is will the manangement team keep enough focus on the gold possibilities and will the cash resources stretch to cover all their project dreams? De Grey are much more focused and they have already brought in shareholder partners to fund further development
Royal Dutch Shell plc (RDSA.AS): European Oil Producer. Rolled up December 2020 strike 28 call options to December 2020 strike 30 call options locking in 65% blended profit since July and December 2016. Most recent tranche bought was in February 2018 offering a 103% profit. Trade idea is to invest the profits in the rolled up contract and use the investment amount for other things. Premium on the new contract was a modest 9% of strike with 4 and a half years to go to expiry.
See TIB240 for the discussion and charts on this contract.
iShares MSCI Saudi Arabia ETF (KSA): Saudi Arabia Index. Saudi Arabia will be included in FTSE Emerging Markets index from 2019 and MSCI should follow soon thereafter. Saudi Arabia has been largely closed to foreign investors but is opening up now so that it can meet the requirements for inclusion. Saudi government is working actively to change the dependence of the economy on oil which makes investing in the market attractive for reasons other than oil price. The trade idea came from a Real Vision interview which pointed out that performance is somewhat uncorrelated to oil and other markets.
First thing to do is to put a few stocks on charts to eyeball for correlations firstly with oil price. The Saudi ETF has only been listed for 2 years and does not go back as far as the last oil price collapse.
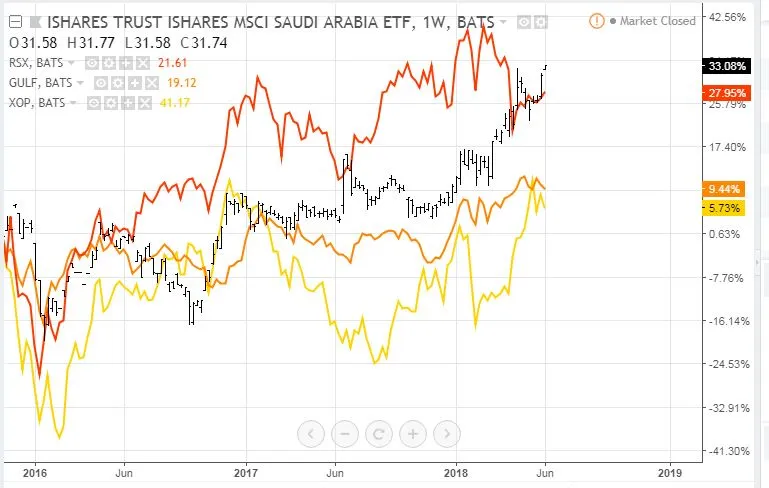
KSA (black bars) has outperformed the Wisdom Tree Middle East ETF (GULF - ochre line) and US Oil Producers ETF (XOP - yellow line) but has largely under-performed van Eck Vectors Russia ETF (RSX - top orange line) until recently. There appears to be some correlation in the early part of the chart with all counters falling and then rising together.
I went searching for a correlation tool to calculate the correlations and I went a bit wider than these 4 counters and added in an integrated oil producer (Chevron CVX) and an Oil Services ETF (OIH) and ETFs for the major economies of the world (Europe, US, Japan and China).
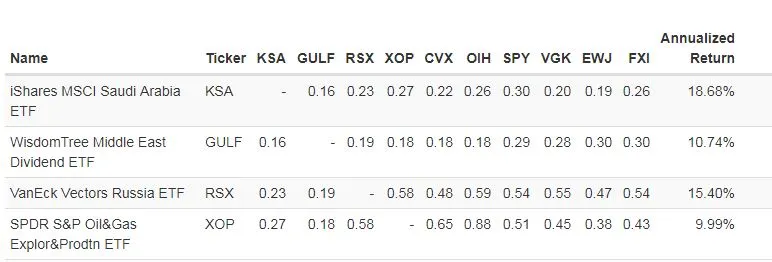
The table is easy to read - read along the KSA line and see the correlation coefficient with each of the counters. Correlation coefficients are scored between -1 and 1 with 1 being perfectly positively correlated. What stands out is correlations with the rest of the Middle East (GULF) and oil (RSX, XOP. CVX, OIH) and major economies (US - SPY, Europe - VGK, Japan - EWJ, China - FXI) is uniformly low. The investment thesis then is KSA becomes something of a hedge play that is riding on Saudi Arabia achieving its modernisation away from oil and inclusion in the major indices in 2019.
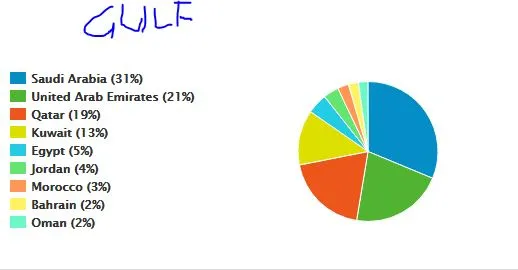
I do hold shares in the Wisdom Tree Middle East ETF (GULF) of which Saudi Arabia is the largest holding. One could invest solely in this ETF as it has similar correlations to KSA.
I started with a small holding and will progressively grow this as I close out other more correlated positions.
The other part of the correlation matrix shows how strongly oil (including Russia) is correlated with world markets (all above 50%)
https://www.portfoliovisualizer.com/ is a free tool which covers a full range of US listed stocks and ETF's
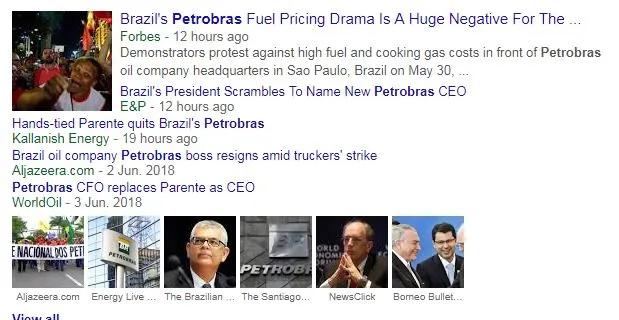
Petróleo Brasileiro S.A. (PBR): Brazilian Oil Producer. The CEO of Petrobras resigned amidst the fallout of the truck driver strike objecting to market pricing for diesel fuel.
This policy had been instrumental in improving Petrobras's profitability over the last 2 years. Since the truck driver strike started, share price has dropped 45% from a one year high of $17.14.
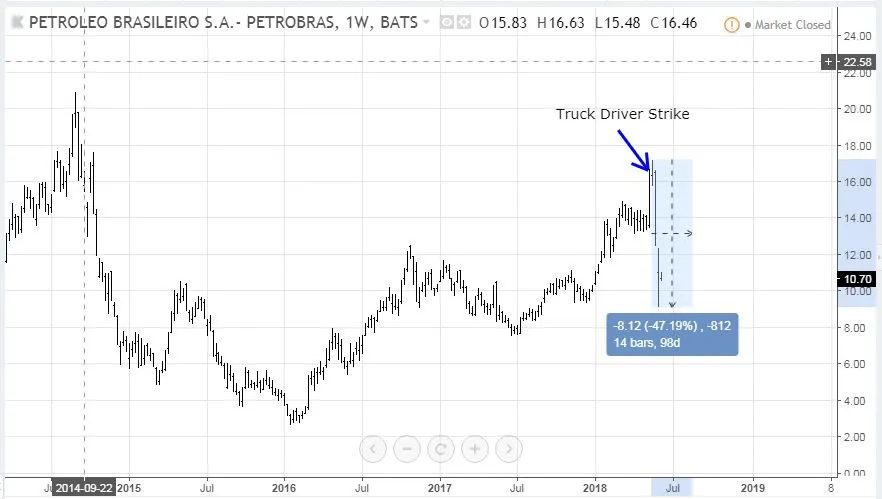
Like all these things, I think the market has over-reacted and I took action to reduce my average entry price. Without political intervention, the new CEO can get the stock price back on trajectory as oil prices rise.
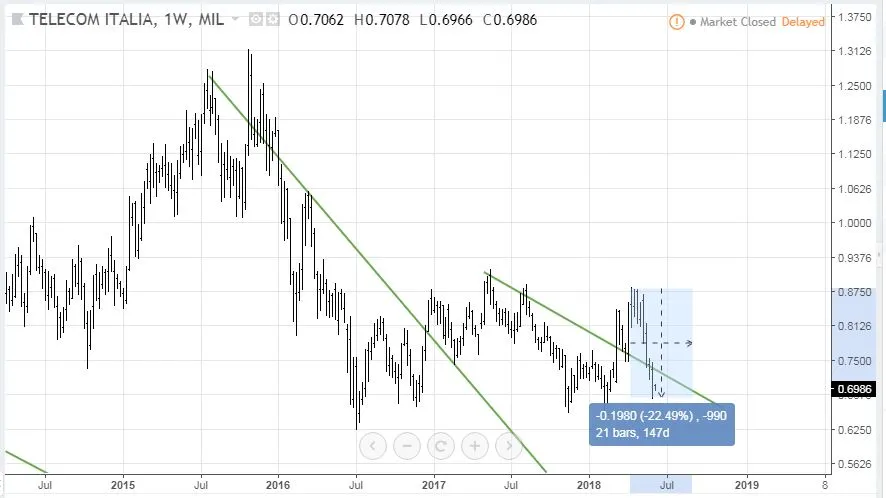
Telecom Italia S.p.A. (TIT.MI): Italian Telecom. Share price has dropped 25% since the inconclusive March election in Italy. I am confident that the business profits have not dropped 25% as a result of the election uncertainty. If anything they have probably been improving as Italy has been growing. I added a small parcel of shares to two portfolios.
Sold
De Grey Mining Limited (DEG.AX): Australian Gold Explorer. De Grey owns gold mining tenements in Pilbara region of Western Australia. They have discovered one of the world's largest gold resources (some say as big as Johannesburg which was the world's largest ever). My plan was to take enough profits to double my holding in Kairos Mining (listed above). I sold a holding for 192% profit since July 2016. I have held onto a parcel of stocks and I do own options which are in-the-money which I plan to exercise soon.
ArcelorMittal (MT.AS): European Steel. With US steel tariffs, one of the potential losers is ArcelorMittal which is one of Europe's large steel producers. I sold an odd lot partial position to round down to a round 200 shares (which are being used to trade covered calls). 62% profit since November 2016. The rationale for steel was that price to book valuations were low and economies were growing. It is too bad the tariff tantrum got in the way of solid economic growth prospects.
ProShares UltraPro QQQ (TQQQ): Leveraged NASDAQ Index. This was a test of a trading idea to use leveraged ETF's to trade relative market dynamics between the S&P500, Nasdaq, Treasuries and the VIX. I found that I did not have the bandwidth to keep track and was not enjoying the volatility from the leverage. I closed out the trial for a 6.5% profit since March 2018.
It does not make sense to close out a trade on the day the Nasdaq makes a new high but I was out of patience with the trial. That said, it is nice to have trial that makes a solid profit in a short time.
Cisco (CSCO): US Technology. Cisco have done a remarkable job in transforming the commodity networking hardware business into a more dynamic software and services business. I sold January 2019 strike 35 call options for 415% profit since December 2016. I continue to hold call options in one of my other portfolios. I will review 2020 call options for part of the profits on this trade.
Cryptocurency
Bitcoin (BTCUSD): Price range for the day was $315 (4.1% of the high). Price tested the old support line and rejected it.
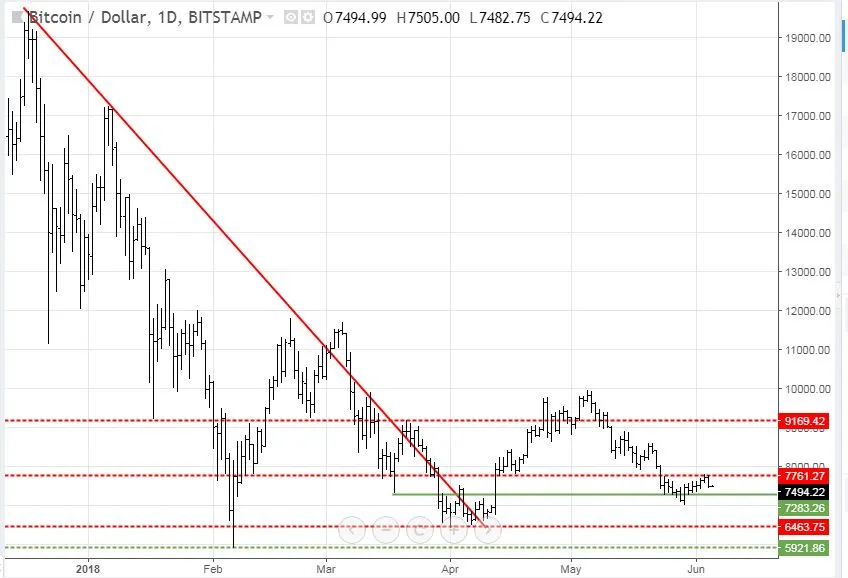
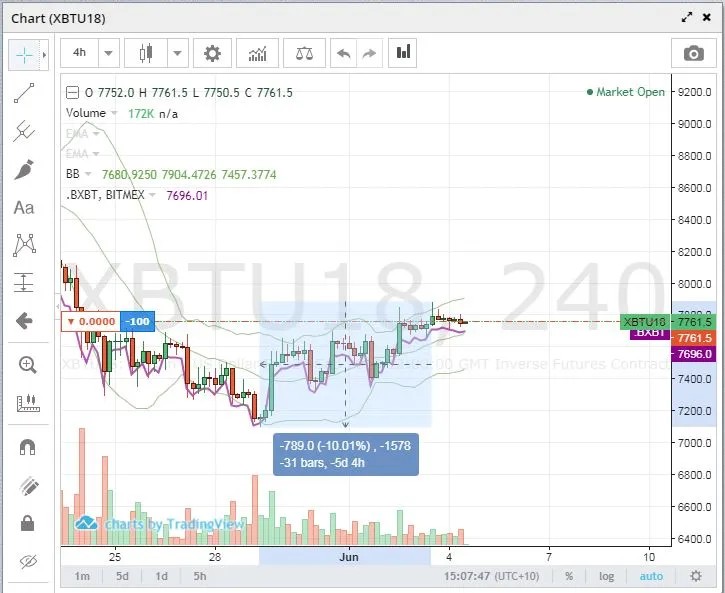
That rejection was enough for me to add a short position in my Bitmex account using September futures at $7761. This resistance level is 10% above the support line which is enough space to make a 2X leveraged trade profitable
CryptoBots
Outsourced Bot No closed trades on this account (212 closed trades). Problem children was unchanged (>10% down) - (14 coins) - ETH, ZEC(-41%), DASH (-43%), ICX, ADA, PPT, DGD, GAS (-47%), STRAT, NEO (-46%), ETC (-43%), QTUM, BTG (-48%), XMR.
ZEC went back to 40% down list and DGD dropped below 40% down. BTG remains the worst at -48% with NEO/GAS not far behind.
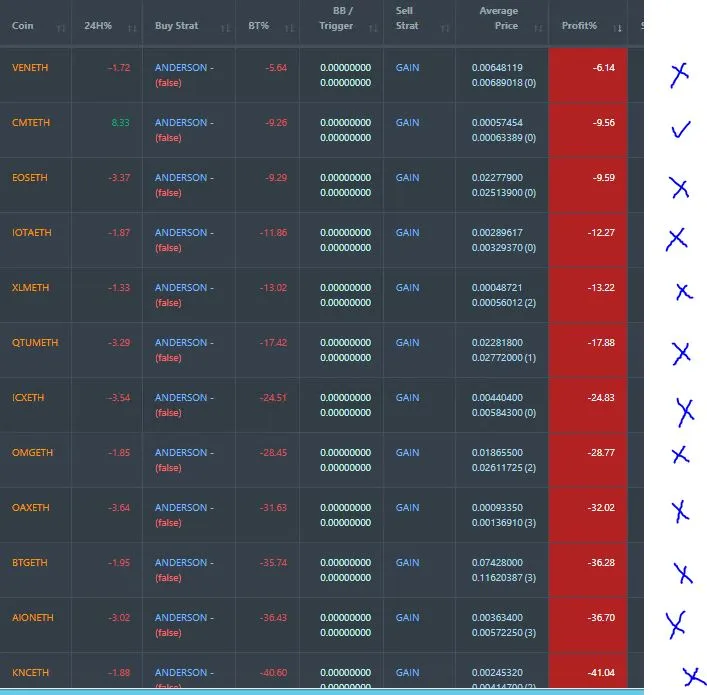
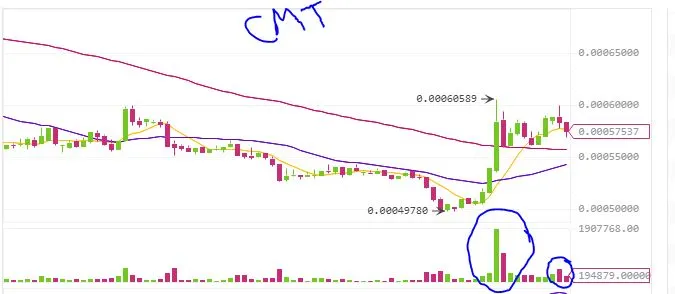
Profit Trailer Bot Dollar Cost Average (DCA) list remains at 12 coins with 1 coin (CMT) improving and the other 11 worse.
The CMT chart shows a pump and dump operation with spikes in volume driving price higher and then the selloff in two waves.
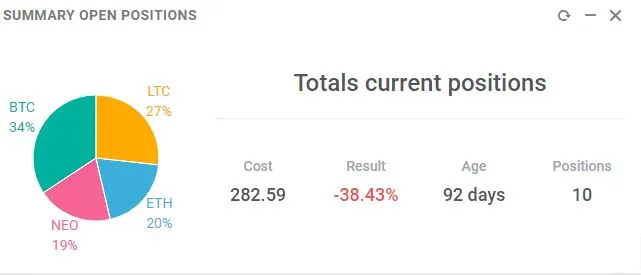
New Trading Bot Positions dropped 3 points to -38.4% (was -35.7%).
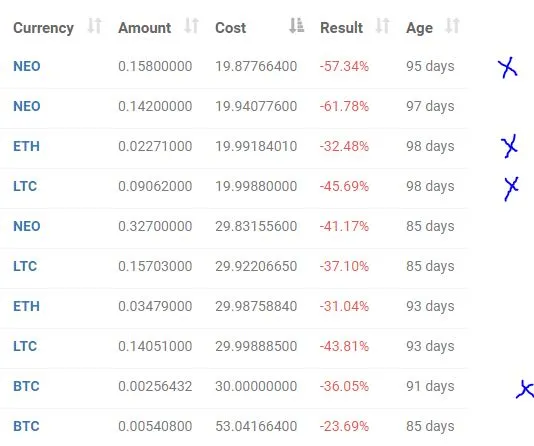
All 4 coins traded worse by 2 or 3 points. This list has been in this shape for over 3 months - this is a holding strategy and not a bot strategy.
Currency Trades
Forex Robot did not close any trades and is trading at a negative equity level of 1.8% (lower than prior day's 9.6%). This bot has never traded this low and I fully expect it to close a lot of trades overnight. The net trading equity is actually positive with swap interest making the overall equity negative.
Outsourced MAM account Actions to Wealth closed out 1 trade for 0.13% profits for the day.
Cautions: This is not financial advice. You need to consider your own financial position and take your own advice before you follow any of my ideas
Images: I own the rights to use and edit the Buy Sell image. News headlines come from Google Search. China tariffs image comes from CNBC.com. Other images are credited below images. Chart images are created using my various trading and charting platforms. They are all my own work
Tickers: I monitor my portfolios using Yahoo Finance. The ticker symbols used are Yahoo Finance tickers
Charts: http://mymark.mx/TradingView - this is a free charting package. I have a Pro subscription to get access to real time forex prices
Crypto Trading: get 6 months free trades with Bitmex for leveraged crypto trading. http://mymark.mx/Bitmex
Bitcoin: Get started with mining Bitcoin for as little as $25 http://mymark.mx/Galaxy
June 4, 2018