
SUMMARY
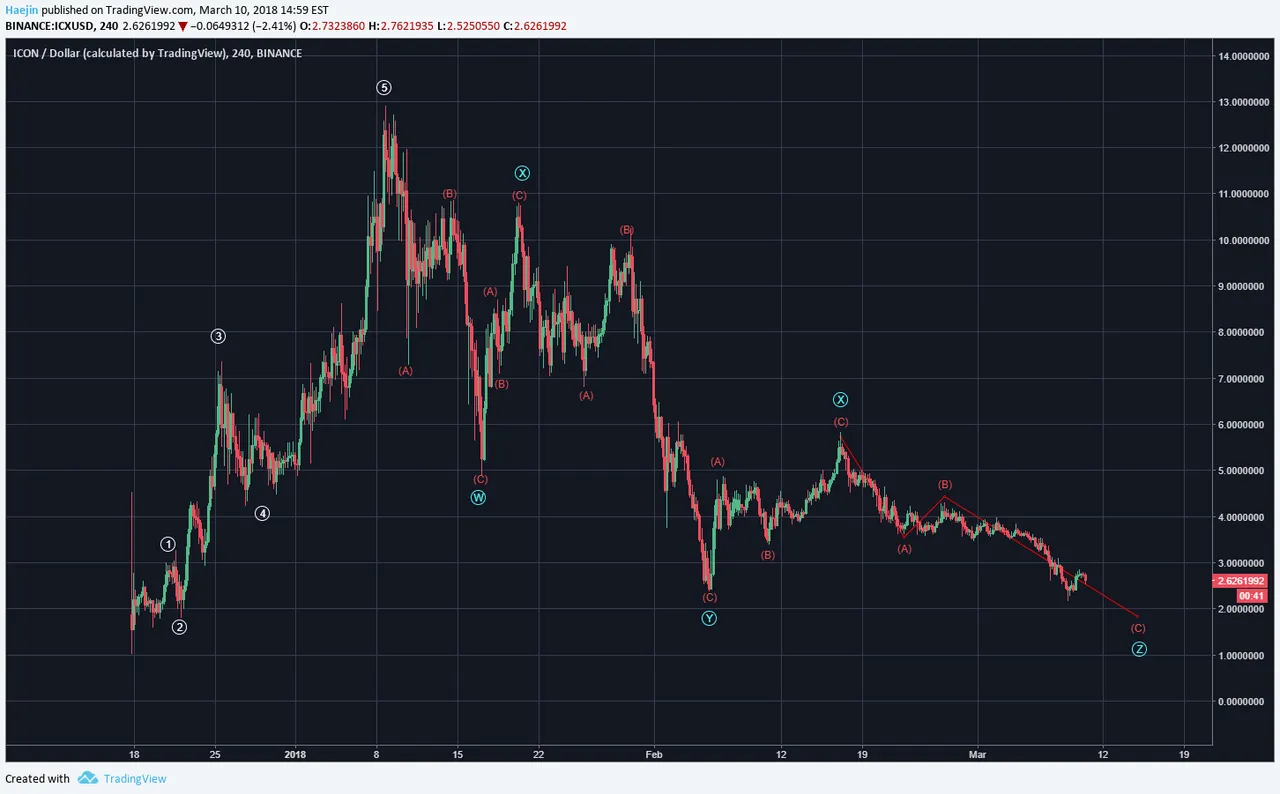
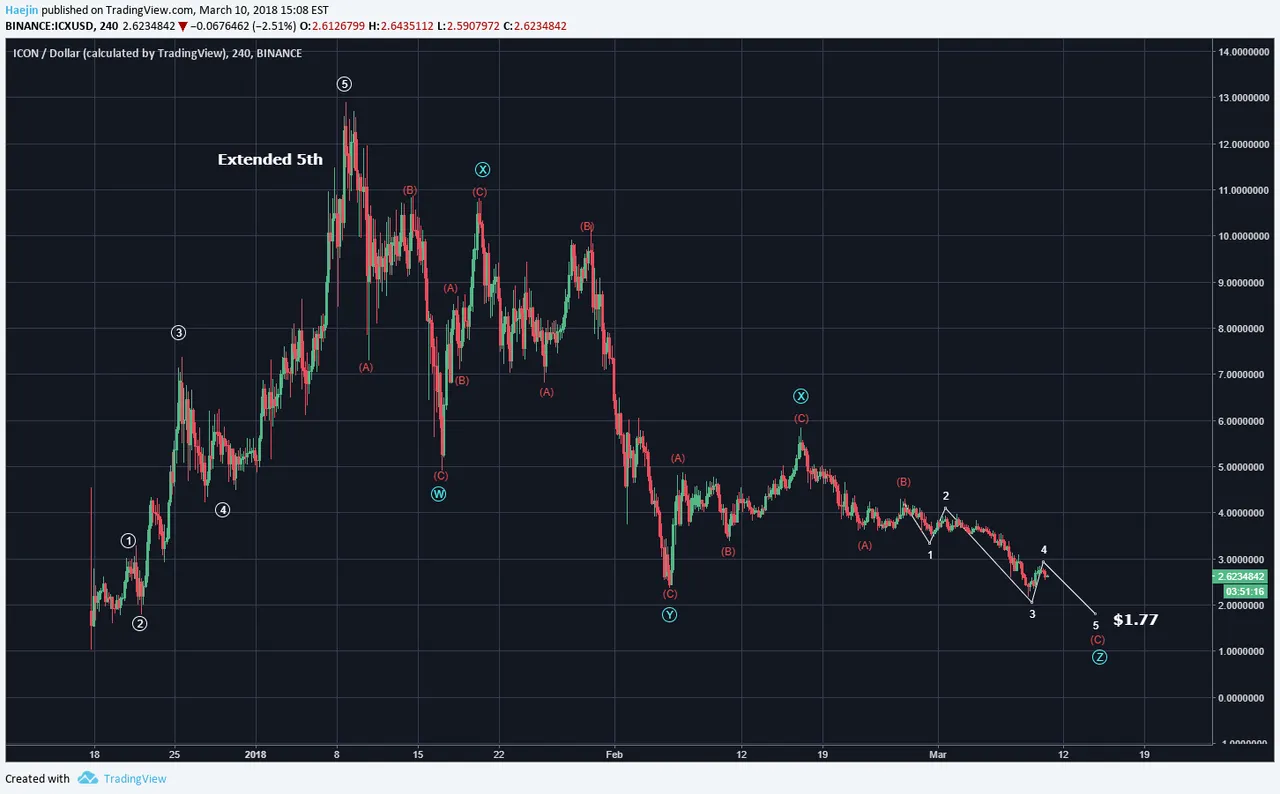
What happens when there is an extended 5th? The prior five waves are deeply retraced in a counter trend correction. This is why when there is an extended 5th wave, you turn and run with your profits, don' walk. Cryptos have a uniquely high affinity and propensity to put in wave 5s that can be quite extended and most visible in the daily scale charts. In addition, the deepness of the retrace doesn't mean swift but rather very drawn out, incremental and often torturous for many traders. For instance, the below chart of ICON (ICX) shows a flawless execution of this where the blue WXYXZ started with a very sideways price action leading to lower and lower declines.
The subwaves have been filled in and more than 65% of the time, the correction often travels as low as the prior wave 2. Without an extended 5th; the retrace targets the prior wave 4. Therefore, if ICX retraces to the prior wave 2; that'll place it at about $1.77 or about 33% lower. Considering the entire correction and degree measured in price and not %; the correction could be near complete.
Legal Disclaimer: I am not a financial advisor nor is any content in this article presented as financial advice. The information provided in this blog post and any other posts that I make and any accompanying material is for informational purposes only. It should not be considered financial or investment advice of any kind. One should consult with a financial or investment professional to determine what may be best for your individual needs. Plain English: This is only my opinion, make of it what you wish. What does this mean? It means it's not advice nor recommendation to either buy or sell anything! It's only meant for use as informative or entertainment purposes.
Please consider reviewing these Tutorials on:
Elliott Wave Counting Tutorial #1
Elliott Wave Counting Tutorial #2
Elliott Wave Counting Tutorial #3
Laddering and Buy/Sell Setups.
Laddering Example with EOS
Tutorial on the use of Fibonacci & Elliott Waves
@haejin's Trading Nuggets
Essay: Is Technical Analysis a Quantum Event?
Follow me on Twitter for Real Time Alerts!!
Follow me on StockTwits for UpDates!!
--
--

