This post is meant as a journal to keep track of my trade ideas in the crypto space. Most of my trading decisions in both equities and crypto are based on technical analysis (TA). Feel free to disagree and question my views in the comments section. A healthy discussion is always welcome.
Current price structure
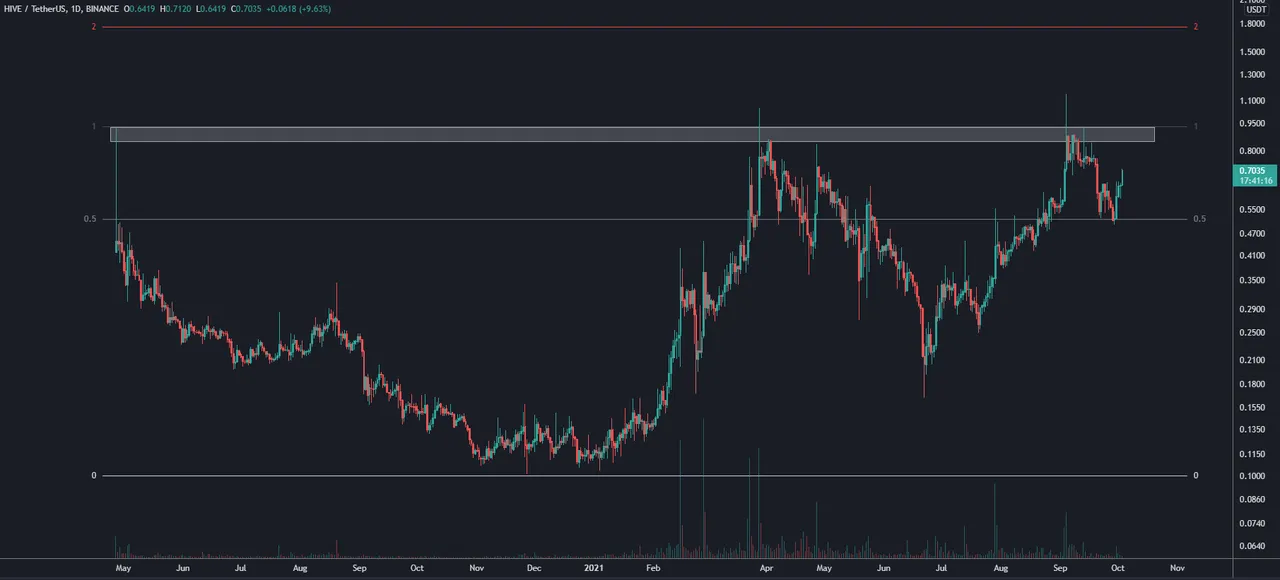
Since 2020, $HIVEUSDT has been continuously rejected whenever it tries to breach the 1 area (shaded rectangle). I believe that there is a high probability of this changing this quarter as will be laid out below.
The recent correction in HIVE might seem deep because of the %change from 0.93 to 0.51 area, but it was actually shallow if you look at the big picture. Big picture-wise, it found support at the 50% range of April '20 high and Nov '20 low. This gives us a bullish conviction for HIVE's price structure.
A bonus for this is the Cup and Handle pattern formation in the overall price structure of HIVE (see image attached above). As silly as it is to bet your money based on chart patterns, we can't deny the series of higher lows that we are already seeing in $HIVEUSDT. What this basically means is buyers are now willing to buy at a higher price just to get their hands on HIVE.
Trade plan
- Entry: A consolidation near the white rectangle AND above the 50% range is ideal.
- Cut loss: Candle low of new base (see Entry)
- Target price: Measured target of 1.74 (= to x2 of range)