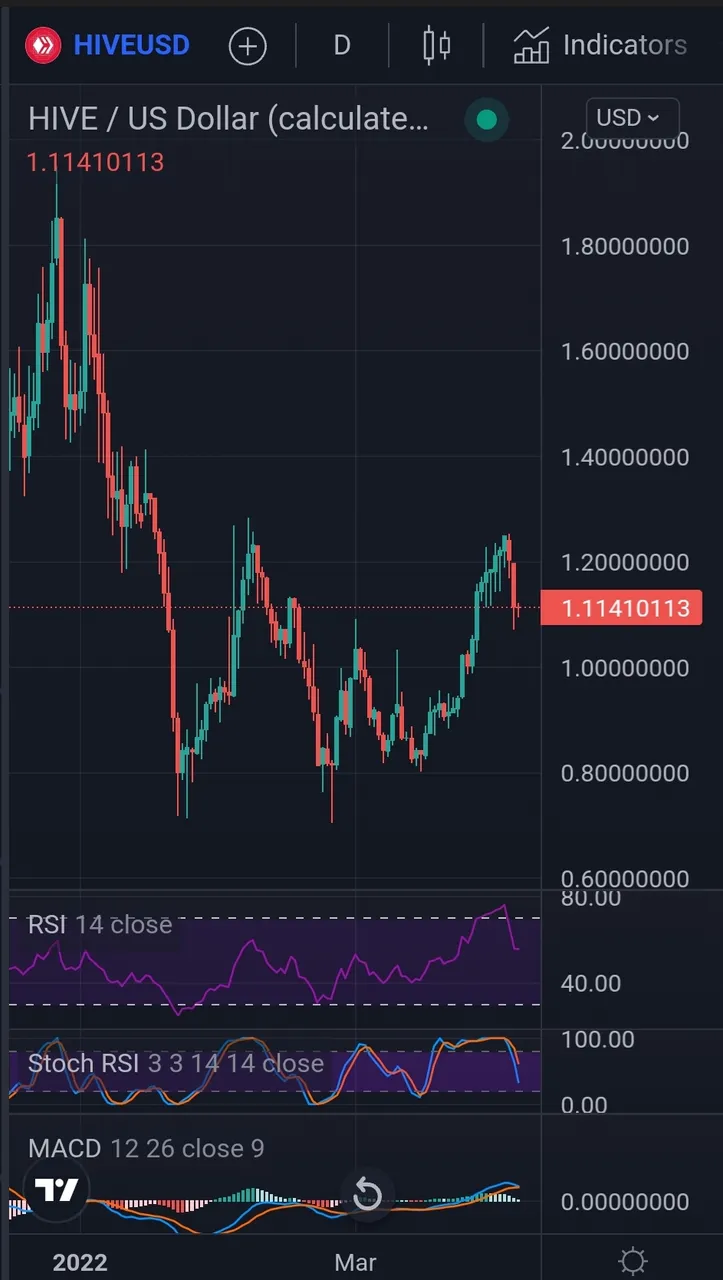
It has been a couple weeks of healthy green candle action, but quite suddenly, as usual, we have turned back down along side of the rest of markets.
For a reference i have a daily candle picture from last week. (Below).
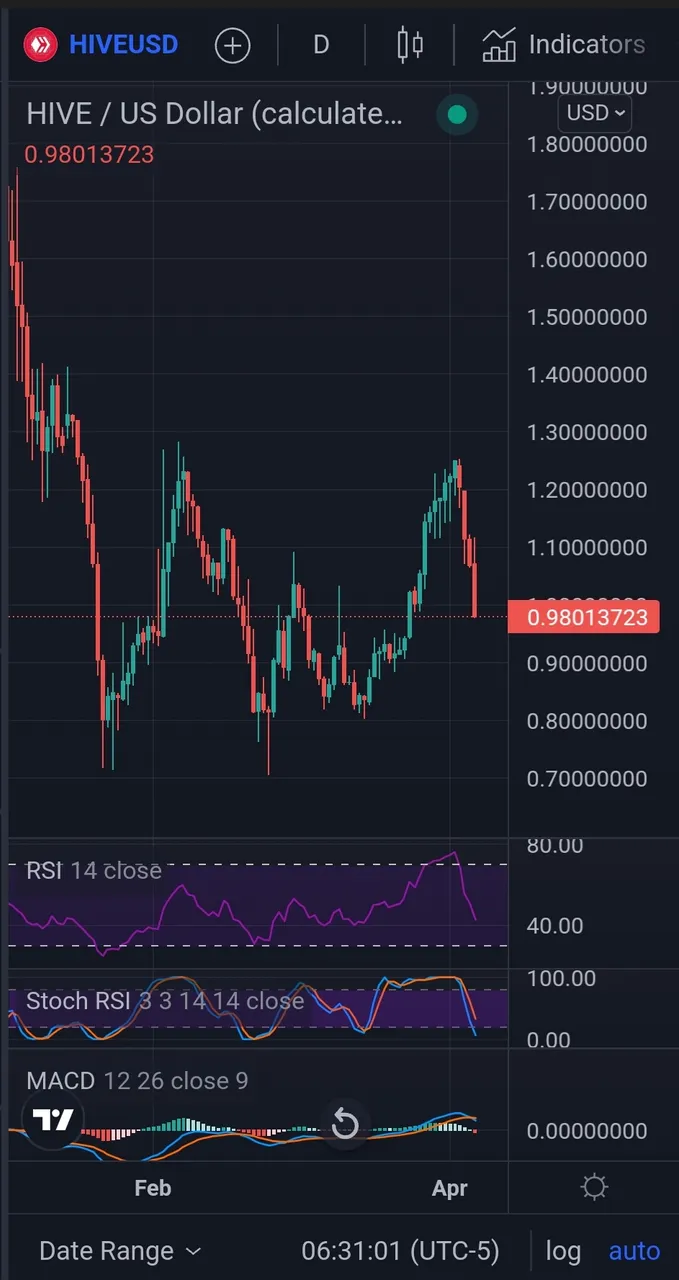
Back to the current moment though, and sitting very close to $1.00. I think how i am missing a nice moving average indicator on my chart but i am limited to just 3 things and i already have the rsi, stoch rsi, and macd. Moving averages do help find interesting spots in the chart.
Otherwise rsi, and stoch rsi, both pointing down. MACD has a fresh crossover on its averages. Lets look at the weekly, maybe try to take off an rsi and put a moving average on.
Zoomed out, long term view, weekly candle, with a triple ema.
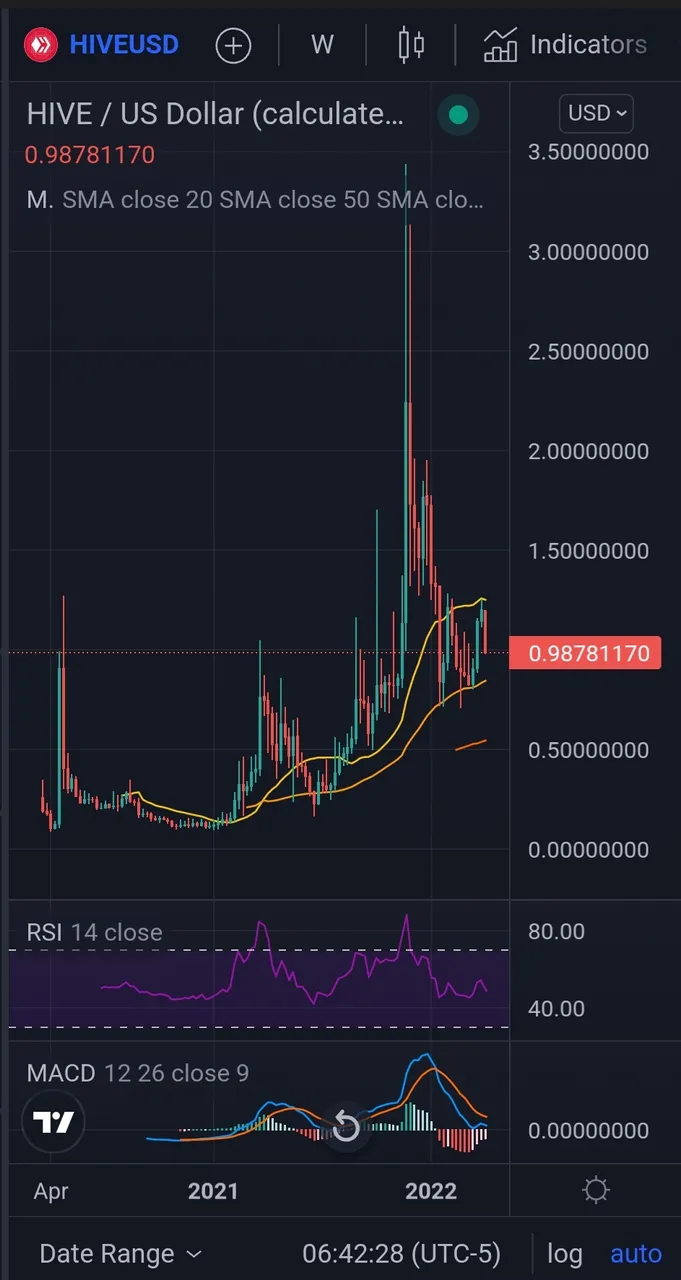
That is quite a nasty candle on the weekly though, referring to this week currently. Lets take a closer look.
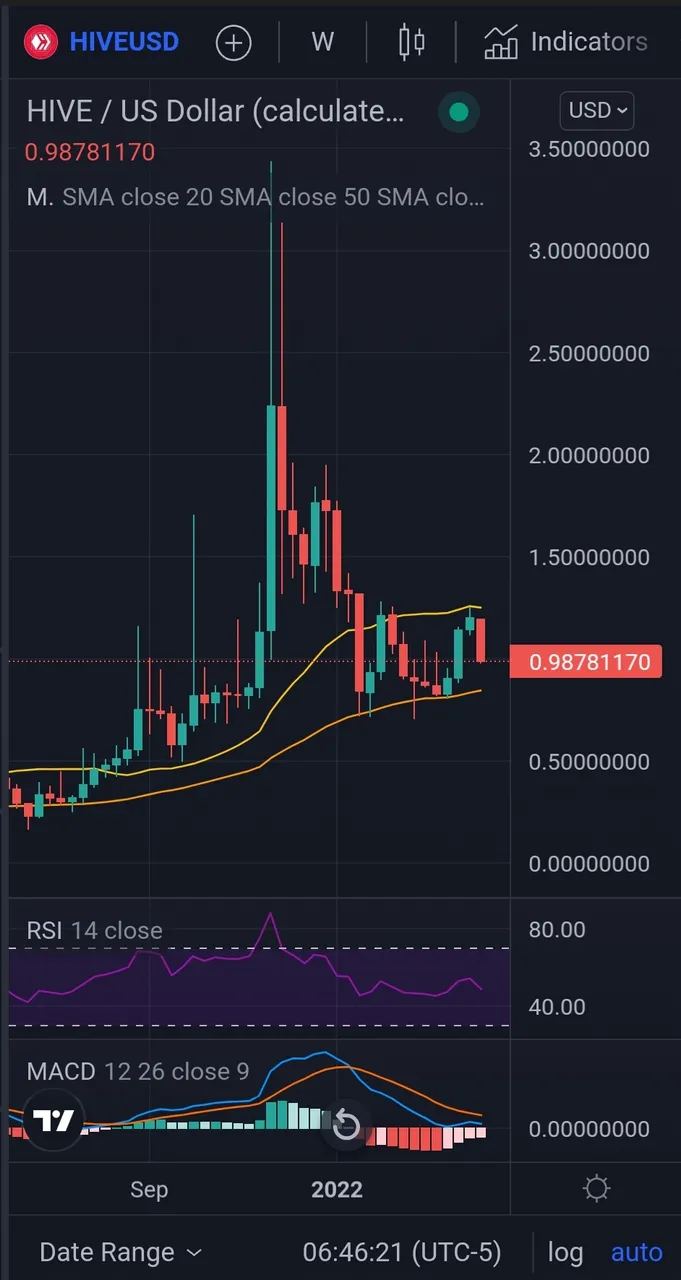
All in all, maybe we will find some support. Global tensions, drama in the news, usual nonsense, all influencing markets.
Im doing my duty and doing rounds, to stake my daily rewards.
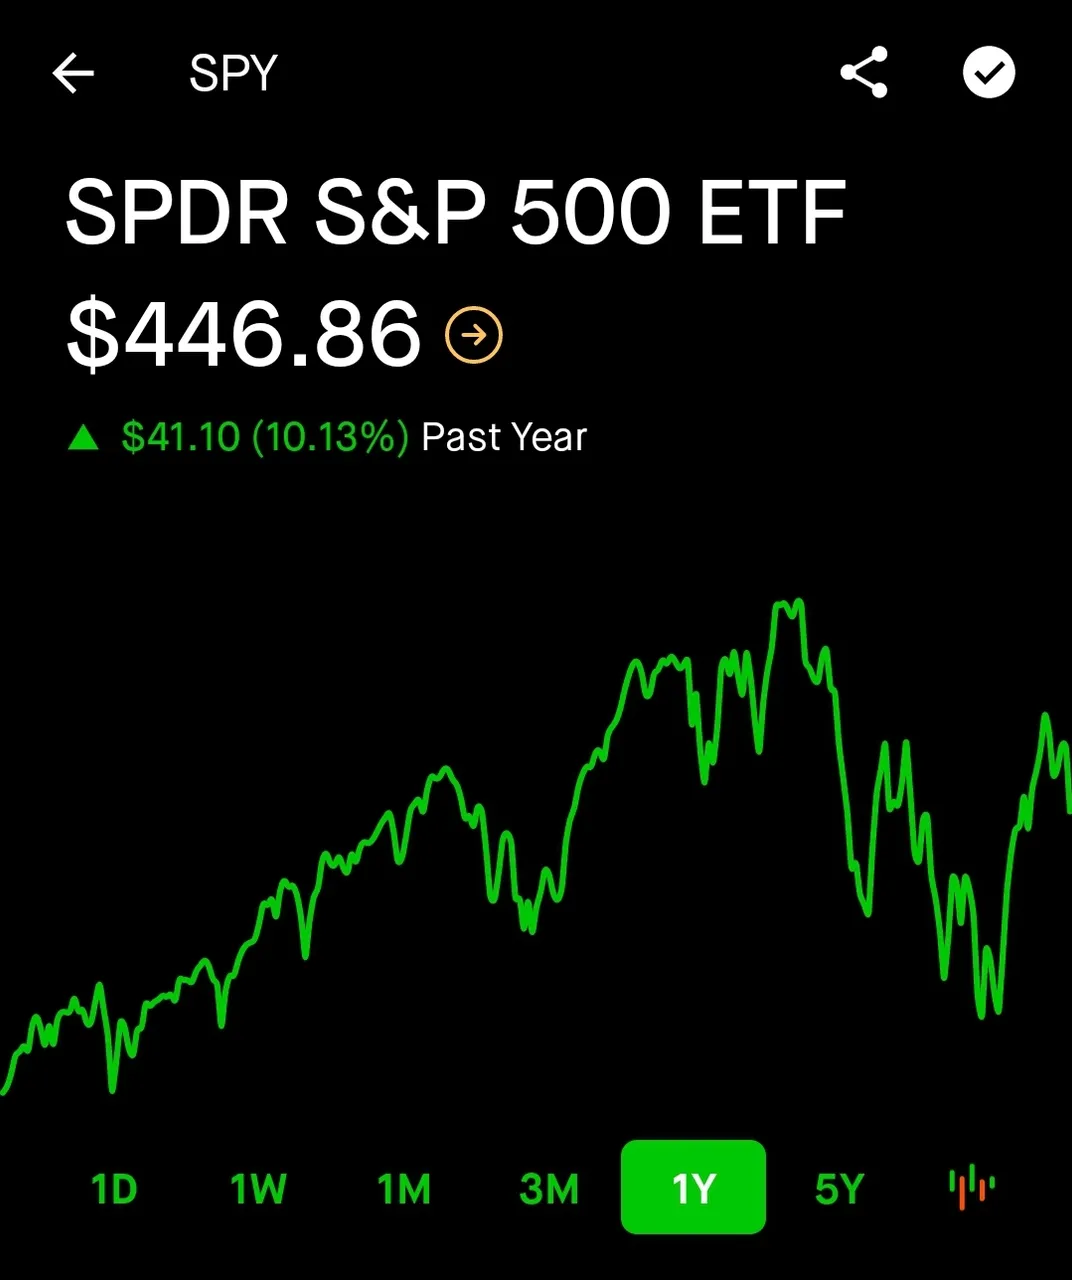
We are trending right along with overall crypto market and the SPY it appears. Getting that mid week, end week, selling. Nasdaq probably looks similar to it. Maybe some sideways action across the board for a while. Few months, couple years? I wouldnt even care, we want some low prices to stake and stack coins anyways.