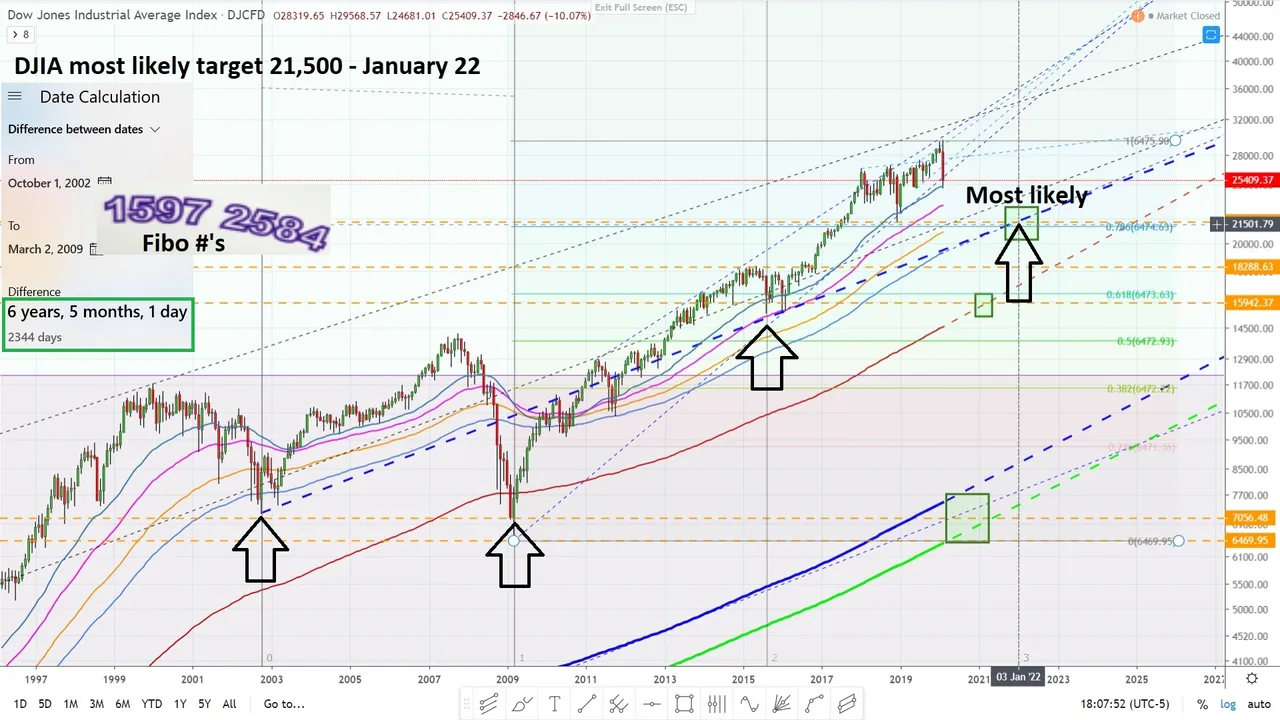
A look at the Dow Jones Industrial Average and the most probable point where and at what time the we could see a potential low.
Projecting time and price is ludicrous really, but still it's a way of looking for exceptions without being too traumatized in the grand scheme of things. In the charts below I chose the most probable point in time and price that we could potentially rest based on moving averages that price has rested upon in the past.
however.....
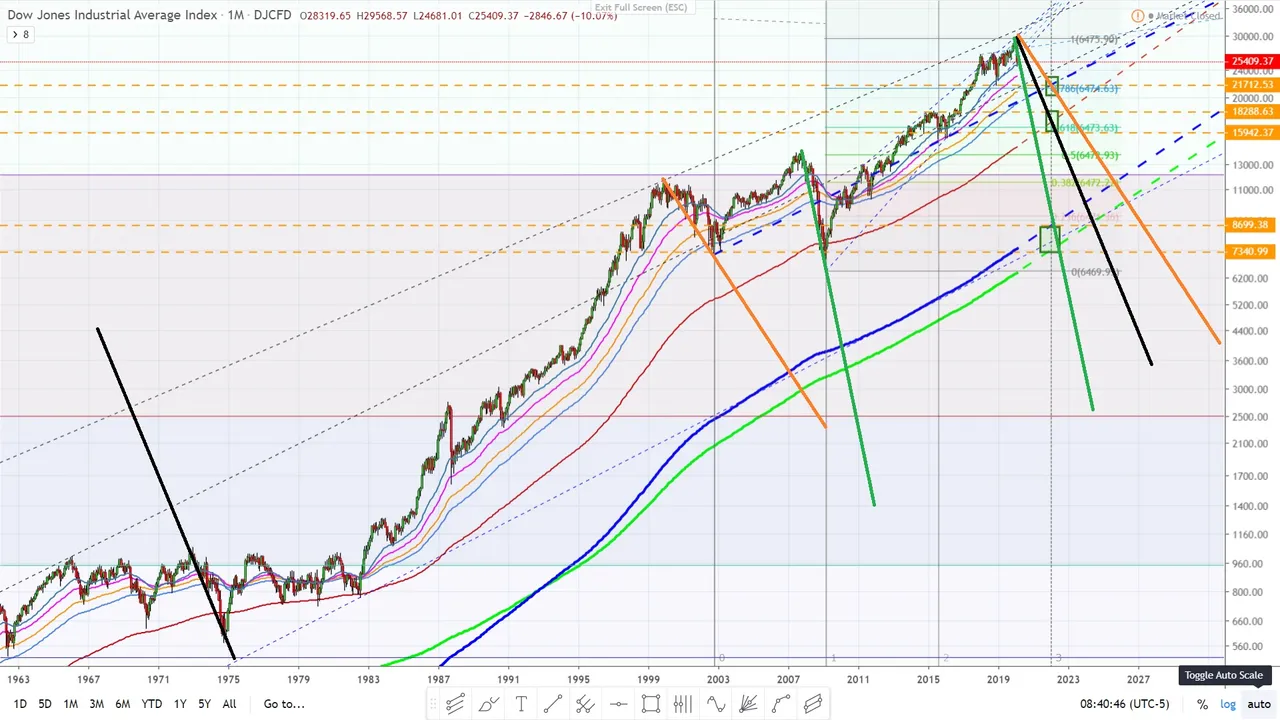
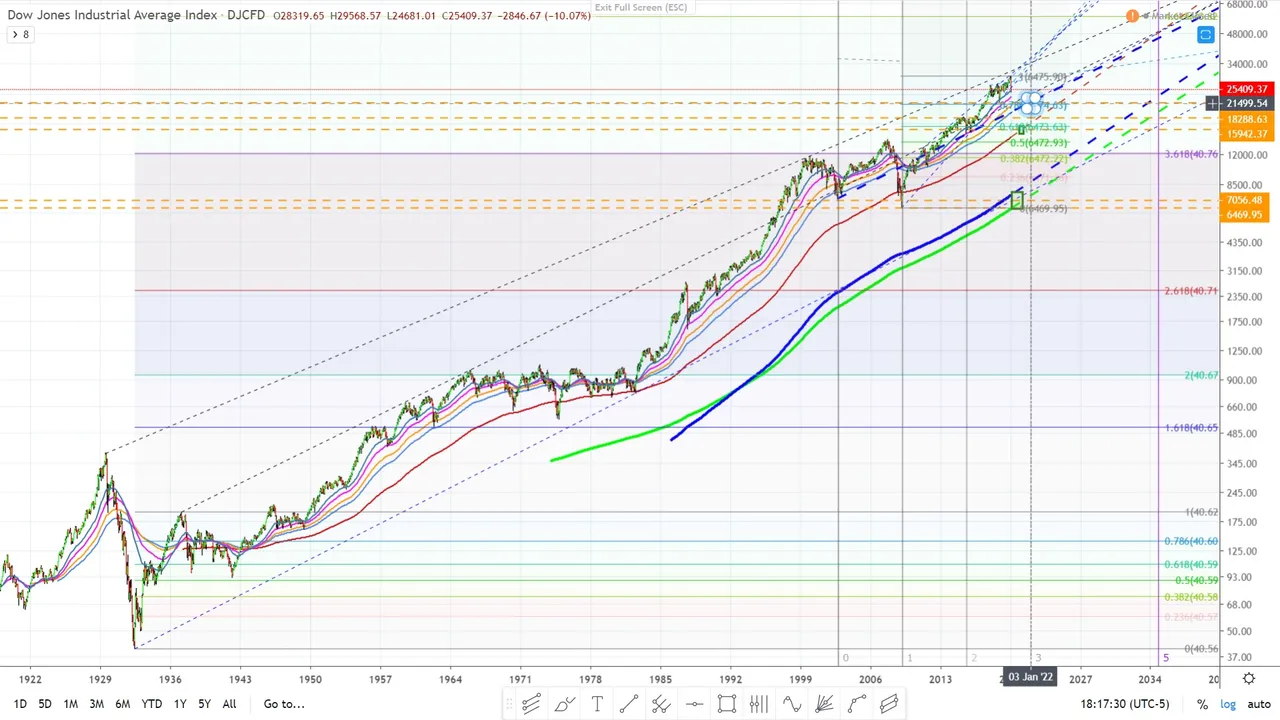
It could be one of the other moving averages noticed in the chart below with the angles of descent. The angles of descent are angles of previous downturns in the market.
Keeping this post short...
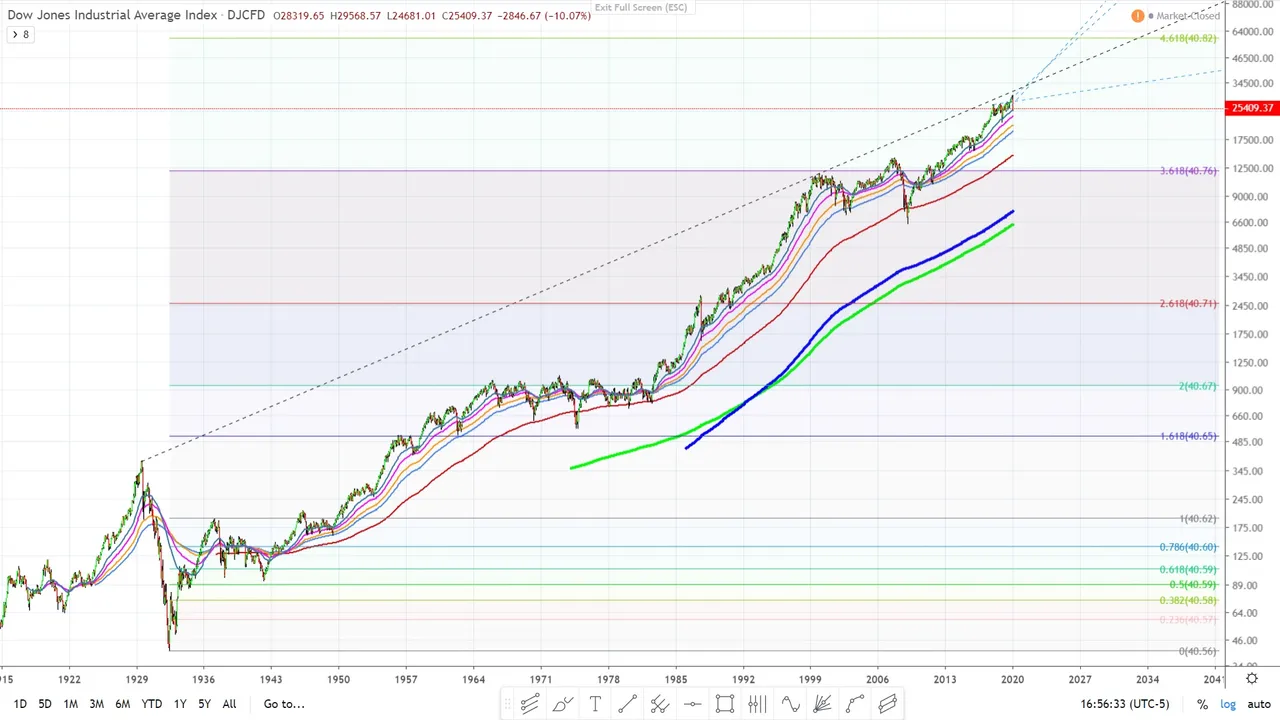
This market could potentially go down to the 2009 lows ....... ouch.
This market could take a 30% hit and rest on the highly probable price indicated in the first chart.
I could ramble on and on, but you get the idea.
cheers,
All data and information provided is for informational purposes only. Trend Wizard makes no representations as to accuracy, completeness, currentness, suitability, or validity of any information in this post and will not be liable for any errors, omissions, or delays in this information or any losses, injuries, or damages arising from its display or use. All information is provided on an as-is basis. I document this stuff for personal reasons as a log and share with the community...... only because I'm a nice person.
So in ending........ Use critical thinking and think for yourself.