Printing text on a screen can be a simple task, displaying variable data makes it more complex but it is still just a matter of adapting the program code, from this point we begin to expand our possibilities with the printing of figures.
In an OLED screen each pixel is separated from its neighbors at practically the same distance and as each pixel can be turned on independently we could draw almost anything we can think of inside the OLED panel.
However doing so requires knowing the different techniques including the proper commands and the correct coordinates that draw the image. In this article we will go a little deeper into OLED technology showing how to present different figures, for this we will describe the commands that allow us to draw each figure with their respective examples.
Imprimir textos en una pantalla puede resultar una tarea sencilla, mostrar datos de una variable lo hace más complejo pero aun asi es solo cuestion de adaptar el código del programa, a partir de este punto comenzamos a ampliar nuestras posibilidades con la impresión de figuras.
En una pantalla OLED cada pixel esta separado de sus vecinos a prácticamente la misma distancia y como se puede encender cada píxel de forma independiente podríamos dibujar casi cualquier cosa que se nos ocurra dentro del panel OLED.
Sin embargo hacerlo requiere conocer las diferentes técnicas que incluyen los comandos adecuados y las coordenadas correctas que trazan la imagen. En este artículo nos adentraremos un poco más en la tecnología OLED mostrando la forma de presentar distintas figuras, para ello vamos a describir los comandos que nos permiten dibujar cada figura con sus respectivos ejemplos.
Importance of being able to use figures |
|---|
Previously we could use the displays to represent any type of data using text, we could question whether it is really necessary to delve into a little more complex issues such as the formation of figures on a screen.
Perhaps the phrase "a picture says more than a thousand words" may be enough to answer that question and is that a text can certainly represent any data, however there is no guarantee that everyone can understand it because there are language limitations and in some cases for people with visual impairment is easier to look at a figure and understand what it is than to stop to interpret a text.
I think the most complete way is to combine both to represent data, we are very close to start learning about SCADA systems and I think that being able to handle graphics on an OLED screen is the perfect introduction to this topic.
When the first digital phones appeared I particularly preferred to see the battery "bar" to know how much power was left, the same happened with the coverage, soon the screens represented everything with icons and to date today the latest generation phones are still copying this method of indication which should tell us that it is definitely something important for an observer.
Anteriormente pudimos usar los displays para representar cualquier tipo de datos usando textos, pudiésemos cuestionarnos si realmente es necesario profundizar en temas un poco más complejos como es la formación de figuras en una pantalla.
Tal vez la frase "una imagen dice mas que mil palabras" pueda ser suficiente para responder a esa pregunta y es que un texto ciertamente puede representar cualquier dato, sin embargo no hay garantía de que todos lo puedan comprender ya que existen las limitaciones de idiomas y en algunos casos para personas con problemas en la vista es más fácil mirar una figura y comprender de qué se trata que detenerse a interpretar un texto.
Pienso que la forma más completa es combinar ambos para representar datos, estamos muy cerca de iniciar los aprendizajes sobre sistemas SCADAS y creo que poder manejar gráficos en una pantalla OLED es la introducción perfecta a este tema.
Cuando surgieron los primeros teléfonos digitales particularmente prefería ver la "barra" de baterias para conocer cuanto de energía quedaba, lo mismo ocurría con la cobertura, pronto las pantallas representaban todo con iconos y a la fecha de hoy los teléfonos de última generación siguen copiando este método de indicación lo que debe decirnos que definitivamente es algo importante para un observador.
 Pixabay
Drawing techniques |
|---|
When we are going to design any application for an OLED panel we definitely must know the characteristics of the panel to use, one of these is the width x height in pixels because through this feature we will know the area on which we can work and the sizes in pixels that we can use for our figures.
Each pixel will be represented by a unique coordinate and those coordinates are given by the screen size, for example if we have a panel of 128x64 pixels our working range will be from the coordinates 0,0 to 128,64 and within that range will be all the pixels we can work with.
It is important to know each area used to avoid overlapping two figures in the same place as this may cause an undesired result.
It is also important to know in which pixel starts and ends our figures, if we draw a rectangle that starts at 0.0 and we give a width of 20 we must take into account that I can not start another figure between pixels 0.0 and 20.0 because this area will be occupied by the rectangle, ideally start at pixel 0.21 or 0.22 so that there is a space of one or 2 pixels between the two figures.
As the OLEDs can be on or off we can create figures with fill (pixels within the edges on) or without fills, so we can represent two types of figures, full and empty and this is useful when we represent the state of a storage container.
Cuando vamos a diseñar alguna aplicacion para un panel OLED definitivamente debemos conocer las características de dicho panel a usar, una de estas es el ancho x alto en pixeles porque mediante esta característica conoceremos el área sobre la cual podemos trabajar y los tamaños en pixeles que podremos usar para nuestras figuras.
Cada píxel estará representado por una coordenada única y esas coordenadas son dadas por el tamaño de pantalla, por ejemplo si tenemos un panel de 128x64 pixeles nuestro rango de trabajo será desde las coordenadas 0,0 hasta la 128,64 y dentro de ese rango se encontrarán todos los píxeles con los que podemos trabajar.
Es importante conocer cada área usada para evitar superponer dos figuras en un mismo sitio ya que esto puede provocar un resultado indeseado.
También es importante conocer en qué pixel inicia y terminan nuestras figuras, si dibujamos un rectángulo que inicia en 0,0 y le damos un ancho de 20 debemos tomar en cuenta que no puedo iniciar otra figura entre los pixeles 0,0 y 20,0 porque esta área estará ocupada por dicho rectángulo, lo ideal seria inicial en el pixel 0,21 o 0,22 para que exista un espacio de uno o 2 pixeles entre ambas figuras.
Como los OLEDs pueden estar encendidos o apagados se pueden crear figuras con relleno (Píxeles dentro de los bordes encendidos) o sin rellenos, así podemos representar dos tipos de figuras, las llenas y las vacías y esto es útil cuando representamos el estado de algún contenedor almacenador.
 Pixabay
Functions |
|---|
Thanks to the SSD1306_OLED.c library we can draw anything we can think of, although the more complex the drawing is the more work and domain required, in this case the function SSD1306_DrawPixel(uint8_t x, uint8_t y, int1 color = TRUE); will allow us to light pixels independently, it would be like creating images using points and it can be difficult but it is possible.
You can also combine that function with for structures or other techniques to generate images faster, however it requires more knowledge.
We are still getting into it so we are going for simpler functions that can make our work easier and we will leave the function of activating independent pixels as a method of fine tuning details when necessary.
Gracias a la librería SSD1306_OLED.c podremos dibujar cualquier cosa que se nos ocurra, aunque mientras más complejo sea el dibujo mayor será el trabajo y el dominio requerido, en este caso la función SSD1306_DrawPixel(uint8_t x, uint8_t y, int1 color = TRUE); nos permitirá encender píxeles de forma independiente, sería como crear imágenes usando puntos y puede ser difícil pero se hace posible.
También se puede combinar esa función con estructuras for u otras técnicas para generar las imágenes con mayor velocidad, sin embargo se requiere un mayor conocimiento.
Nosotros aún estamos entrando en tema así que vamos por funciones más simples que nos pueden facilitar el trabajo y dejaremos la función de activar píxeles independientes como un método de afinar detalles cuando sea necesario.
➤ Drawing lines
If we consider our OLED panel as a Cartesian coordinate plane we could locate two points inside the plane and join them by a straight line that joins those points, we would only need the x,y coordinates of each point.
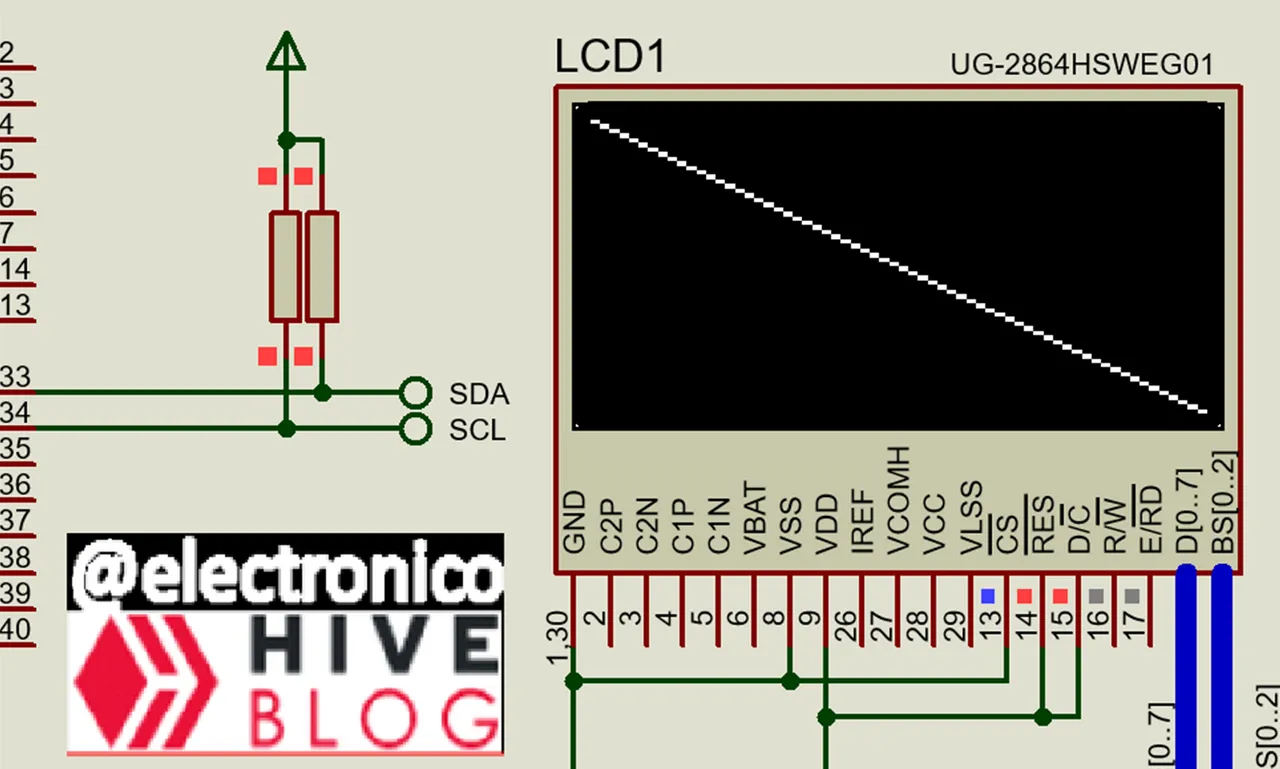
We can do this in our OLED panel using the function SSD1306_DrawLine(int16_t x0, int16_t y0, int16_t x1, int16_t y1); where x0,y0 are the coordinates of the first point and x1,y1 those of the second point, as our panel is 128x64 let's see an example drawing a diagonal line going from point 0,0 to 128,64. Our code would be:
Si consideramos nuestro panel OLED como un plano de coordenadas cartesianas pudiéramos ubicar dos puntos dentro de dicho plano y unirlos por una línea recta que une dichos puntos, solo necesitaríamos las coordenas x,y de cada punto.
Esto lo podemos hacer en nuestro panel OLED mediante la funcion SSD1306_DrawLine(int16_t x0, int16_t y0, int16_t x1, int16_t y1); donde x0,y0 son las coordenadas del primer punto y x1,y1 las del segundo punto, como nuestro panel es de 128x64 vamos a ver un ejemplo dibujando una recta en diagonal que vaya desde el punto 0,0 hasta el 128,64. Nuestro código sería:
  SSD1306_DrawLine(0, 0, 128, 64);

   SSD1306_Display();
With this command we can draw a line between two points whichever and with any slope inside the OLED panel, however there are other commands like SSD1306_DrawFastHLine(uint8_t x, uint8_t y, uint8_t w); to draw horizontal lines defining the coordinates x,y as the output point and w as the size in pixels of the line.
In the same way verticals can be made with the function SSD1306_DrawFastVLine(uint8_t x, uint8_t y, uint8_t h); where x,y is the output point and h the size of the line in pixels.
Mediante este comando podremos dibujar una línea entre dos puntos cuáles sea y con cualquier pendiente dentro del panel OLED, sin embargo existen otros comandos como SSD1306_DrawFastHLine(uint8_t x, uint8_t y, uint8_t w); para dibujar líneas horizontales definiendo las coordenadas x,y como el punto de salida y w como el tamaño en píxeles de dicha línea.
De la misma forma se pueden hacer verticales con la función SSD1306_DrawFastVLine(uint8_t x, uint8_t y, uint8_t h); donde x,y es el punto de salida y h el tamaño de la línea en píxeles.
➤ Drawing rectangles
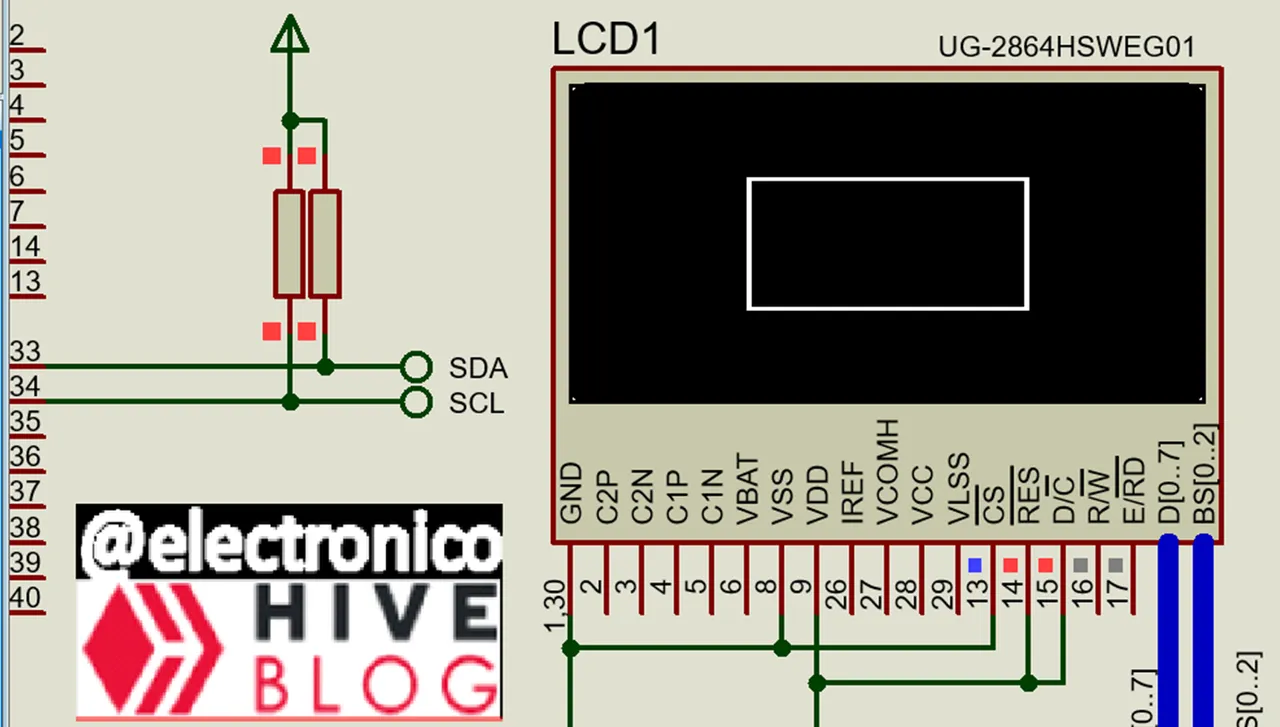
We can draw full rectangles or empty rectangles, in both cases only the function changes, however the parameters will be the same, in the case of empty rectangles the function will be: SSD1306_DrawRect(uint8_t x, uint8_t y, uint8_t w, uint8_t h); where x,y represent the top left corner of the rectangle, starting from that point w represents the width in pixels drawn to the right of x,y and h represents the height in pixels drawn below x,y.
If we want to draw a rectangle in the center of the screen we can choose a size, for convenience of even numbers, for example 60 pixels wide x 30 pixels high, to find the center horizontally we subtract 128 (screen width) - 60 (size used), that would give us 68 and this we must divide by 2 =34, it is divided by 2 because two extremes of separation must be taken into account. So our coordinate in x would be 34
In the case of the point y would be 64-30= 34 this divided by 2 would be 17, our y-coordinate would be 17 and our function to draw the rectangle of that size in the center of the panel would be as follows:
Podemos dibujar rectángulos llenos o rectángulos vacíos, en ambos casos solo cambia la función, sin embargo los parámetros serán los mismos, en el caso de rectángulos vacíos la función será: SSD1306_DrawRect(uint8_t x, uint8_t y, uint8_t w, uint8_t h); donde x,y representan la esquina superior izquierda del rectángulo, partiendo de ese punto w representa el ancho en píxeles que se dibuja a la derecha de x,y y h representa el alto en píxeles que se dibuja por debajo de x,y.
Si queremos dibujar un rectángulo en el centro de la pantalla podemos elegir un tamaño, por conveniencia de números pares, por ejemplo que tenga 60 pixeles de ancho x 30 de alto, para encontrar el centro en horizontal restamos 128 (ancho de la pantalla) - 60 (tamaño usado), eso nos daría 68 y esto lo debemos dividir entre 2 =34, se divide entre 2 porque se deben tomar en cuenta dos extremos de separación. Así nuestra coordenada en x seria 34
En el caso del punto y seria 64-30= 34 esto entre 2 seria 17, nuestra coordenada en y seria 17 y nuestra función para dibujar el rectángulo de dicho tamaño en el centro del panel sería la siguiente:
      SSD1306_DrawRect(34, 17, 60, 30);

      SSD1306_Display();
If we want instead of an empty rectangle to be a filled rectangle we only have to change the word draw for the word fill in the function and it would look like this:
Si queremos que en lugar de un rectángulo vacío sea uno lleno solo debemos cambiar de la función la palabra draw por la palabra fill y quedaría de la siguiente forma:
      SSD1306_FillRect(34, 17, 60, 30);

      SSD1306_Display();

➤ Drawing Circles
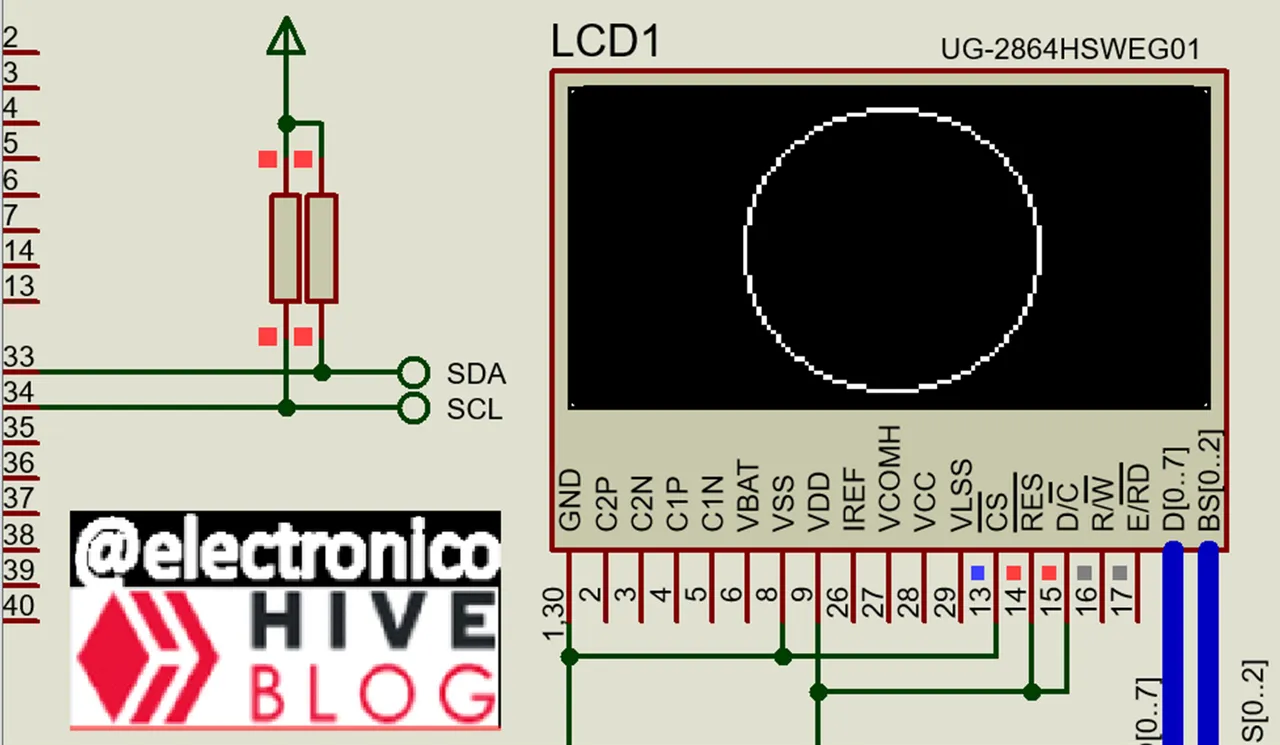
Now suppose we want to draw a circle in the center of the panel with the maximum possible size, the function to draw an empty circle would be: SSD1306_DrawCircle(int16_t x0, int16_t y0, int16_t r); where the x,y coordinates would be the center and r represents the radius.
We would need the center point of our panel, just divide the width and height by 2 and we get the point 64,32 we know that if the height of the panel is 64 and we are in the center a radius greater than 32 would leave our circle outside the panel, for aesthetic reasons it would be convenient to choose a radius of 31, so the function would be written as follows:
Ahora supongamos que queremos dibujar un círculo en el centro del panel con el máximo tamaño posible, la función para dibujar un círculo vacío sería: SSD1306_DrawCircle(int16_t x0, int16_t y0, int16_t r); donde las coordenadas x,y serían el centro y r representa el radio.
Necesitaríamos el punto céntrico de nuestro panel, solo bastaría dividir el ancho y el alto entre 2 y nos queda el punto 64,32 sabemos que si el alto del panel es 64 y estamos en el centro un radio mayor que 32 dejaría nuestro círculo fuera del panel, por razones estéticas lo conveniente sería elegir un radio de 31, de esta forma la función se escribiría como sigue:
      SSD1306_DrawCircle(64, 32, 31);

      SSD1306_Display();
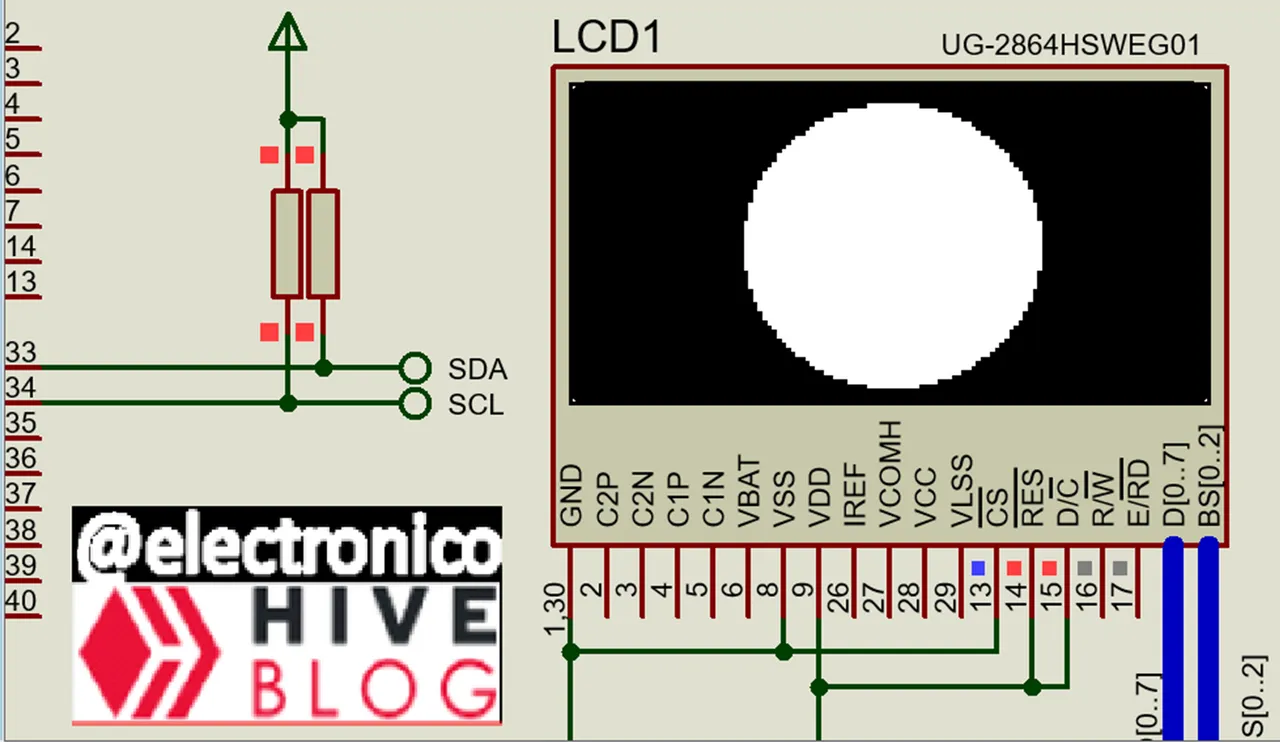
If we want it filled we only have to replace the word Draw by Fill in the function and it would look like this:
Si lo queremos lleno solo debemos reemplazar de la función la palabra Draw por Fill y nos quedaría de la siguiente forma:
      SSD1306_FillCircle(64, 32, 31);

      SSD1306_Display();
➤ Drawing Triangles
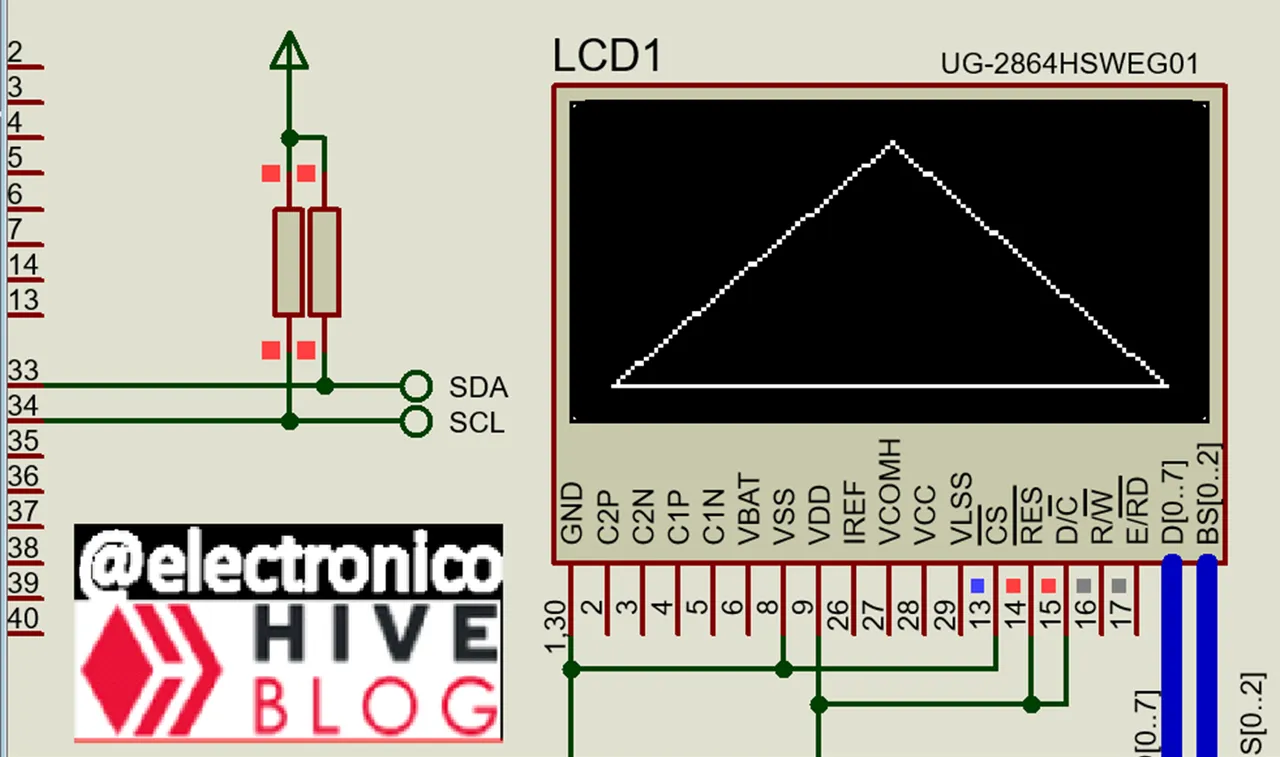
To draw triangles we will need 3 points inside the plane and these will represent a vertex each one, that way we can draw our triangle of the type we want.
The function that allows us to draw is: SSD1306_DrawTriangle(uint8_t x0, uint8_t y0, uint8_t x1, uint8_t y1, uint8_t x2, uint8_t y2); where x0,y0; x1,y1 and x2,y2 represent the points where the vertices of the triangle are located.
Suppose we want to draw a centric triangle in which each vertex is separated 5 pixels from the nearest edge, we could find a point at x0=5, y0=64-5=59; x1=64,y1=5 and x2=127-5=122, y2=59. Our function would look like this:
Para dibujar triángulos necesitaremos 3 puntos dentro del plano y estos representaran un vértice cada uno, de esa forma podemos trazar nuestro triángulo del tipo que queramos.
La función que nos permite el trazado es: SSD1306_DrawTriangle(uint8_t x0, uint8_t y0, uint8_t x1, uint8_t y1, uint8_t x2, uint8_t y2); donde x0,y0; x1,y1 y x2,y2 representan los puntos donde se encuentran los vértices del triángulo.
Supongamos que deseamos dibujar un triángulo céntrico en el que cada vértice esté separado 5 píxeles del borde más cercano, podríamos encontrar un punto en x0=5, y0=64-5=59; x1=64,y1=5 y x2=127-5=122, y2=59. Nuestra función quedaría de la siguiente forma:
      SSD1306_DrawTriangle(5, 59, 64, 5, 122, 59);

      SSD1306_Display();
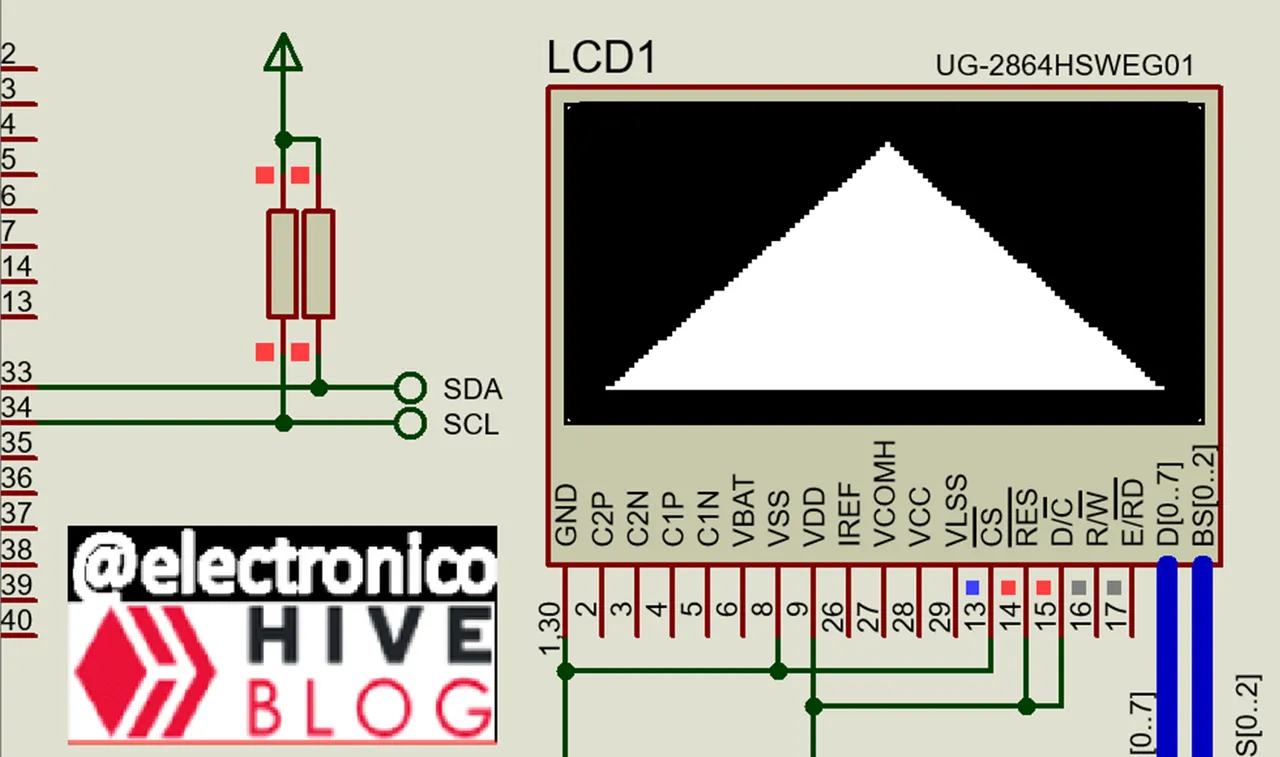
If we want it filled we only have to replace the word Draw by Fill in the function and it would look like this:
Si lo queremos lleno solo debemos reemplazar de la función la palabra Draw por Fill y nos quedaría de la siguiente forma:
      SSD1306_FillTriangle(5, 59, 64, 5, 122, 59);

      SSD1306_Display();
It is important to point out that inside the area of each figure you can show texts or other figures, in this way you can combine two or more figures to create others, here the limit is always the imagination and creativity of each one.
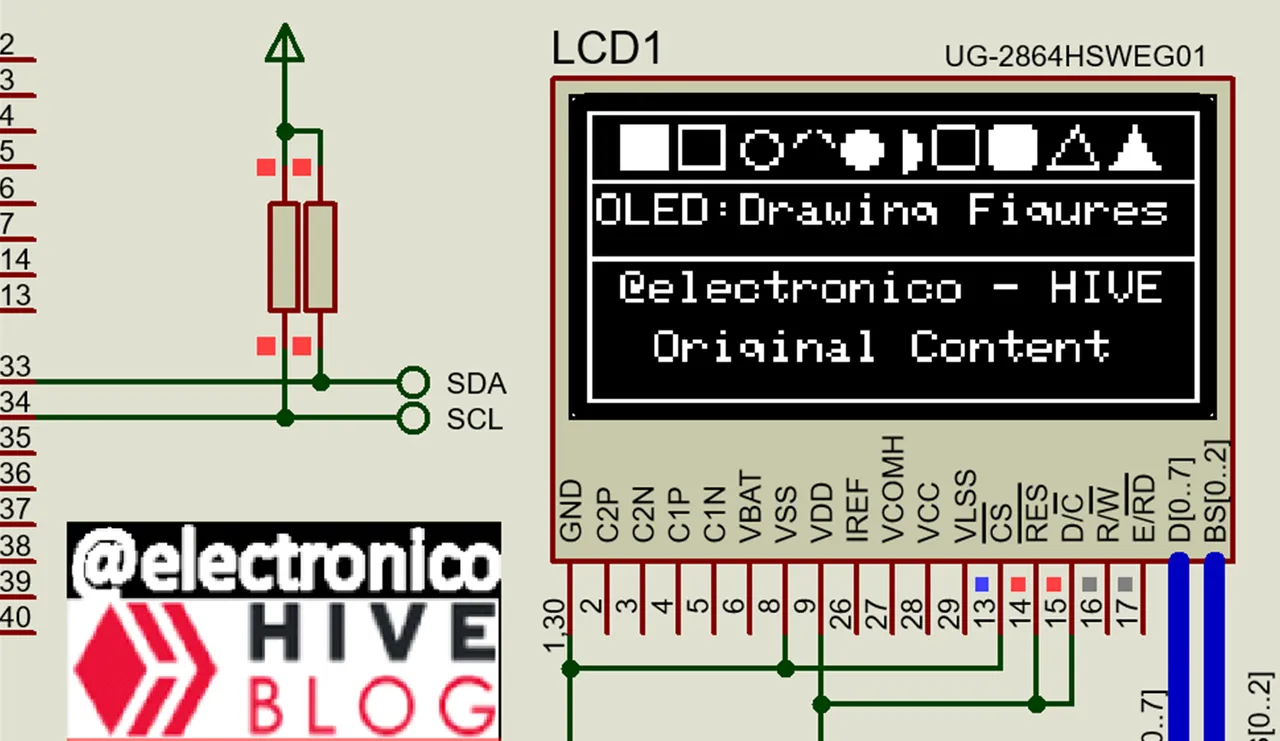
Next I will share with you the code by means of which I created the image that I have used as cover of this article as well as the simulation of the same one.
Es importante señalar que dentro del área de cada figura se puede mostrar textos u otras figuras, de esta forma se pueden combinar dos o más figuras para crear otras, aquí el límite siempre es la imaginación y la creatividad de cada uno.
A continuación te compartiré el código mediante el cual cree la imagen que he usado como portada de este artículo así como la simulación de la misma.
#include <18f4550.h>

#device PASS_STRINGS = IN_RAM

#fuses HS,NOWDT,NOPROTECT,NOLVP,PUT,CPUDIV1,NODEBUG,VREGEN,NOPBADEN

#use delay(clock=20M)

#use I2C(MASTER, SDA=PIN_B0, SCL=PIN_B1, FAST=400000, STREAM=SSD1306_STREAM)

#define SSD1306_I2C_ADDRESS 0x7A

#include

void main()

{

   SSD1306_Begin(SSD1306_SWITCHCAPVCC,

   SSD1306_I2C_ADDRESS);

   SSD1306_ClearDisplay();

   SSD1306_Display();

   while(true)

   {

      SSD1306_DrawLine(0, 0, 127, 0);

      SSD1306_Display();

      delay_ms(200);

      SSD1306_DrawLine(0, 63, 127, 63);

      SSD1306_Display();

      delay_ms(200);

      SSD1306_DrawFastVLine(0, 0, 63);

      SSD1306_Display();

      delay_ms(200);

      SSD1306_DrawFastVLine(127, 0, 63);

      SSD1306_Display();

      delay_ms(200);

      SSD1306_FillRect(7, 3, 10, 10);

      SSD1306_Display();

      delay_ms(200);

      SSD1306_DrawRect(19, 3, 10, 10);

      SSD1306_Display();

      delay_ms(200);

      SSD1306_DrawCircle(36, 8, 4);

      SSD1306_Display();

      delay_ms(200);

      SSD1306_DrawCircleHelper(47, 8, 4, 3);

      SSD1306_Display();

      delay_ms(200);

      SSD1306_fillCircle(57, 8, 4);

      SSD1306_Display();

      delay_ms(200);

      SSD1306_fillCircleHelper(65, 8, 4, 1, 1);

      SSD1306_Display();

      delay_ms(200);

      SSD1306_DrawRoundRect(72, 3, 10, 10, 2);

      SSD1306_Display();

      delay_ms(200);

      SSD1306_FillRoundRect(84, 3, 10, 10, 2);

      SSD1306_Display();

      delay_ms(200);

      SSD1306_DrawTriangle(102, 3, 96, 12, 106,12);

      SSD1306_Display();

      delay_ms(200);

      SSD1306_FillTriangle(114, 3, 109, 12, 119,12);

      SSD1306_Display();

      delay_ms(200);

      SSD1306_DrawRect(0, 15, 128, 18);

      SSD1306_Display();

      delay_ms(200);

      SSD1306_DrawText(2, 18, "OLED:Drawing Figures", 1);

      SSD1306_Display();

      delay_ms(200);

      SSD1306_DrawText(7, 35, "@electronico - HIVE", 1);

      SSD1306_Display();

      delay_ms(200);

      SSD1306_DrawText(14, 48, "Original Content", 1);

      SSD1306_Display();

      delay_ms(200);

      delay_ms(5000);

      SSD1306_ClearDisplay();

      SSD1306_Display();

      delay_ms(300);

   }

}