October has ended and I got some new monthly weather data to document!
In the weather game round 1, there were no participants, which was a bit expected. No problem, I get to keep the reward Hive. You had to guess the minimum temperature of October and be the closest guess. The right answer was -2.4C (27.68F).

Weather Game round 2
For the month of November, you have to guess the strongest wind gust that my weather station records over this month. Just drop your wild guess in the comments below. It can be in m/s, kph, mph, or whatever is suitable for you works.
My monthly summary below might help you decide a bit.
No one knows the right answer yet, the month of November will decide it. I will announce the winner after the month ends.
The closest guess will win 10 HIVE!
Only one guess per person.
The last day to enter your guess is the 17-th of November.
OCTOBER WEATHER SUMMARY
Of course, all the data comes from my own weather station on the roof and is extremely accurate. You can see the September summary here.
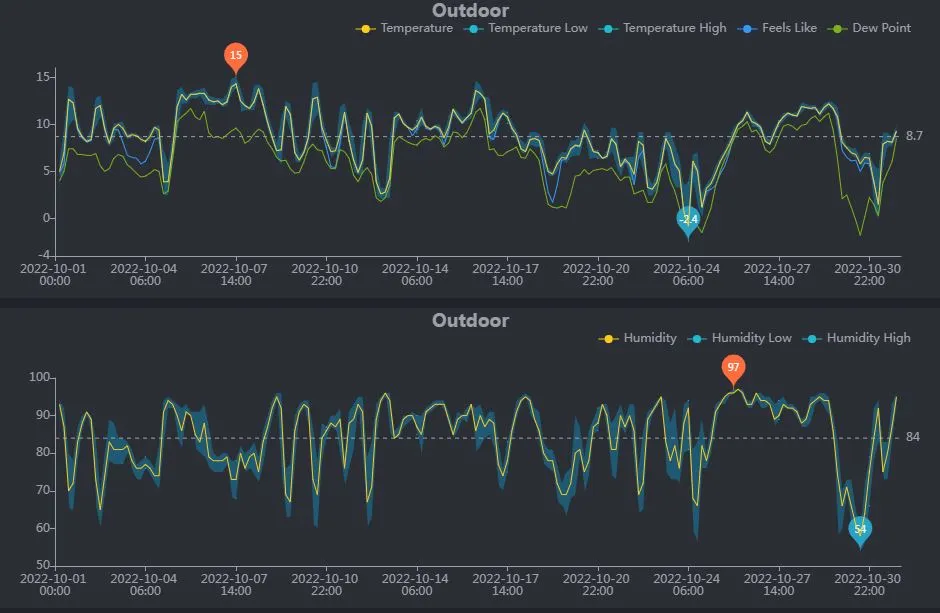
Temperature and Humidity
The trend is getting colder as it should be this time of year though still heavily on the + side. The warmest day last month was +15C(59F) on 7-th and the coldest time was on the 24-th -2.4C(27.68F). The monthly average was 8.7C(47.66F). A very average October temperature wise I would say.
Humidity is getting very irregular. Sometimes it stays very humid for a while. This graph looks nothing like in the summer, then it is very regular. The average air humidity was 84%. It was often very wet this month, this is where it stays very humid.
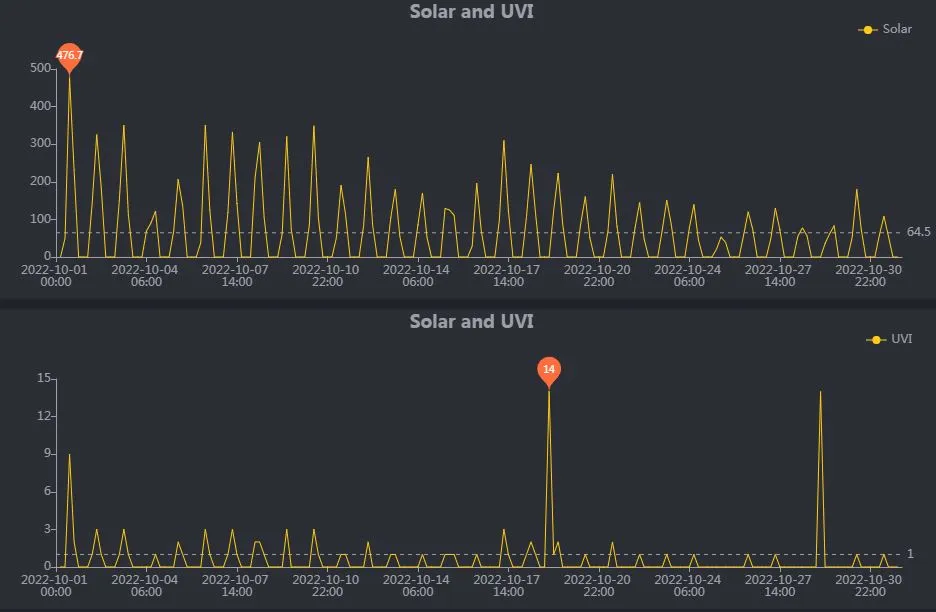
Solar energy and UV radiation.
It is increasingly apparent that solar energy gets lower each day as the days get shorter. Of course, it has been cloudy almost all the time near the end of the month.
UV radiation is also almost non-existent now. The start of the month saw reading up to UV 3 but now it's barely getting to 1. The sun does not get high in our sky anymore, that's why there are no higher readings anymore. In November this reading is mostly 0 all the time I bet.
Dont mind the 14 reading, its a glitch.
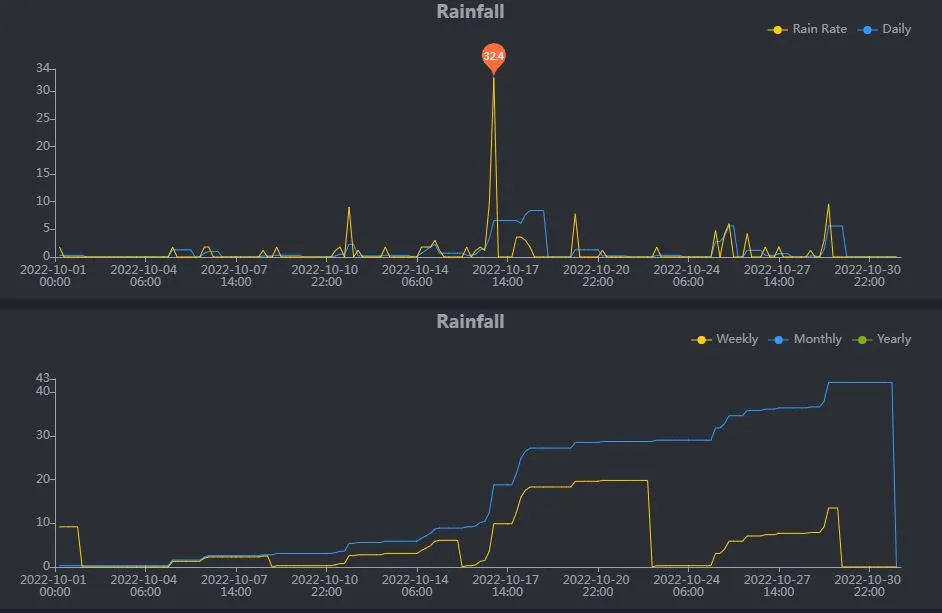
Rainfall
It has been quite a wet month. Much wetter than September was. In the middle of the month, you notice rainfall even with an insane 32.4mm/hr(1.27in/hr) rate. It was the strongest rainfall of the year. I talked about a storm and this event here in this post. Overall the end of the month has seen more rain.
The upper graph shows rainfall intensities and the lower graph shows rain accumulation over the week and month. The total rainfall amount of the month was 42.2mm(1.55in). For example, September had 39.8mm(1.56in). Almost the same but this amount fell only during a couple of rain events and the majority of the month was dry. Look up my last monthly post, the graph is totally different.
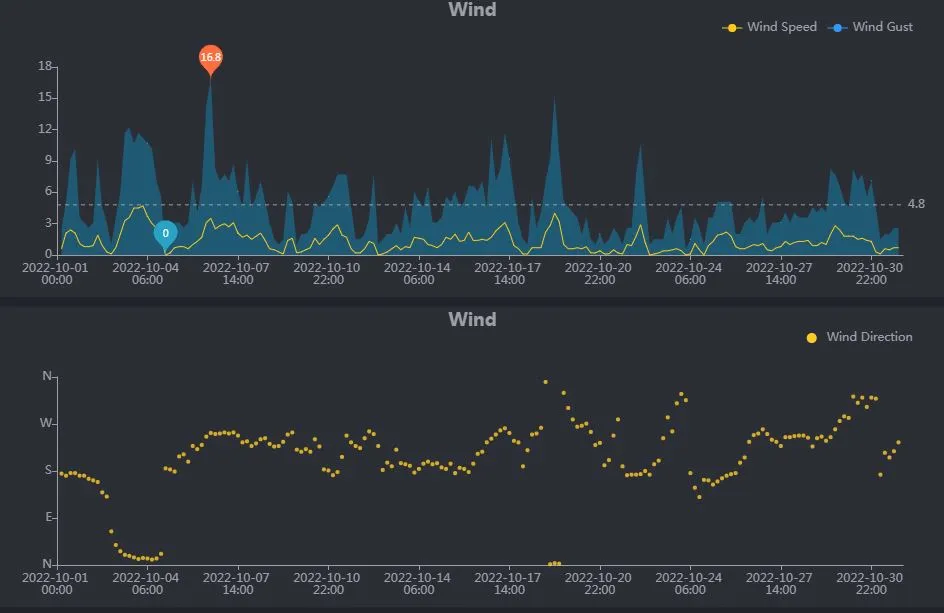
Wind
Overall it has been quite a windy month with a couple of weaker storms. The strongest wind gust happened on the 6-th, during a storm with 16.8m/s(37.5mph)speed. This is what you need to guess for the next month, how strong of a wind gust do I see this month?
The average wind speed was 4.8m/s(10.7mph). September average was 4.3m/s(9.6mph).
As the lower graph shows, the majority of the wind came from the west direction.
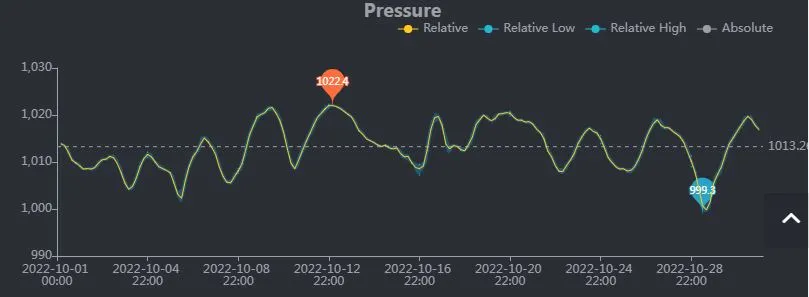
Air Pressure
Air pressure was the highest on the 13-th with 1022.4hPa and the lowest on the 29-th with 999.3hPa. Barely getting below 1000. Higher pressure generally indicates better weather. Nothing too interesting on this graph this time.
So that was the weather in October. Generally nothing unusual, typical weather for this month with an exception of this insane rainfall event. That was cool!
Don't forget to participate in the weather game if you want to win some HIVE and let's see whose guess is the closest!