September is over and I can do the first monthly post of the statistics that come straight from my own weather station on my roof. I find it extremely interesting, to watch the graphs and see how the weather changes during the month or even year. When the year is over then I will definitely make a year summary too.
I also decided to make things more interesting and make this into a game where you can participate too and try your luck with parameter guessing, I have chosen for the next month. More on this later in this post.

First, let's see how the weather was and developed during the last month of September. How do I get the graphs you might ask? The weather station on the roof broadcasts info after every 16 seconds to the tablet in the house. The tablet will send the info to the internet where I can remotely see everything and the program also forms the graphs and a bunch more.
Temperature and Humidity
The daytime temperatures of September have been exceptionally consistent. The highest was 17.9C(64.22F) on 10-th of the month. The median looks to be 14C(57.2F) for the whole month. Usually, we have much higher temps at the start of September.
Night temperatures have not been that consistent. Interestingly we had a much more colder temperatures at the start of the month and a relatively warm nights in the mid-month. The coldest night was on 4-th of September, only 1.9C(35.42F)low.
All this is visible on the temperature graph
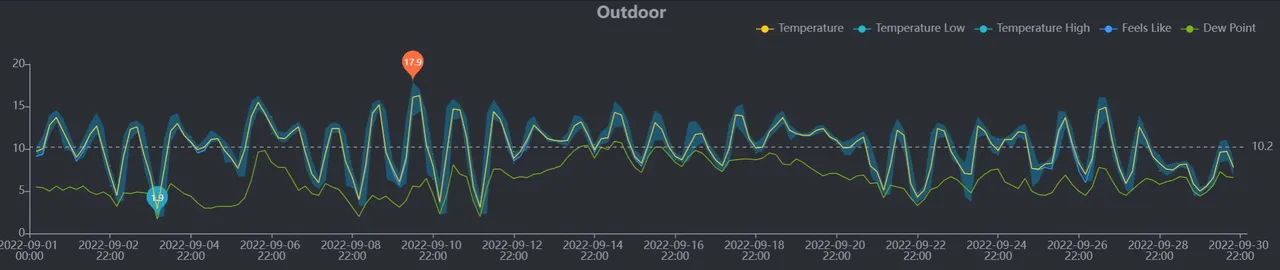
You might want to click and zoom in on the photo to see it better.
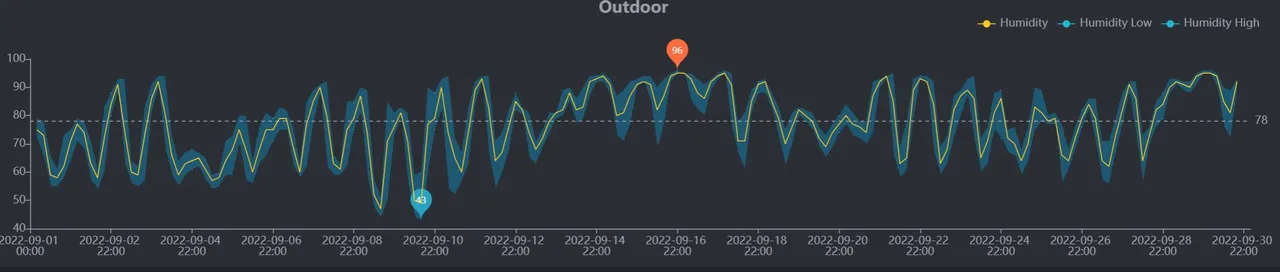
Not that much to say about the humidity graph. Looks to be generally dryer air at the start of the month. The dryest has been the 10-th during daytime with 43% of air humidity, this is also the warmest day I told in the temperature section. The most humid has been the evening of 16-th of Sep. with 96% of air humidity.
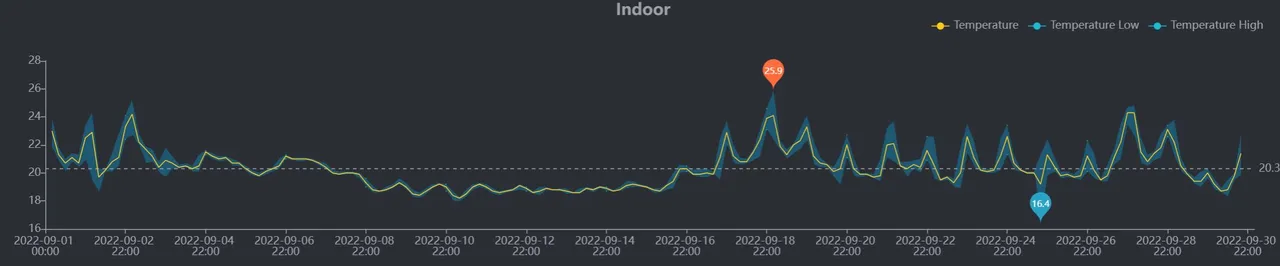
I will also add an indoor temperature sensor too although it's not that interesting to see mostly. The reason I want to add this, look at the start of the month to the middle of the month area, and how cold it was inside the house. That's because I was on Madeira at this time and nothing heated the house. When I was back the temps rose instantly, even though I didn't heat the house. That's just from living in it and TV-s and PC-s heating.
Solar light and UV
The first graph is sun energy taken by a solar panel that powers the weather station, measured in W/M2. You can see a gradual decrease in solar energy as the sun goes lower each day. The highest energy being on the 1-st of Sept. Pretty cool to see. Some days that have been very cloudy have very low measurements too.

The other graph is UV radiation. This is also gradually decreasing as the sun energy decreases. Getting UV6 at start of the month and only 4 to 5 at the end. Don't mind the UV 14 reading, I think it's just a glitch or is it? Maybe an ozone hole😱. Even on cloudy days, you get UV radiation that burns your skin just a bit less.

Rainfall
Overall September has been unusually dry. No rain in the first half. Then there was a heavy rain event on the 16th. A very heavy downpour with a 15.6mm/hr (0.61in/hr) rain rate. I didn't see it, I was in Madeira still. After the rains in mid-month, there was a long silence again until the last couple of days, we again got something. The monthly total was 39.8mm (1.56in)
The above graph shows the rainfall rate and below is rain accumulation with weekly yellow line and monthly blue line.

Wind
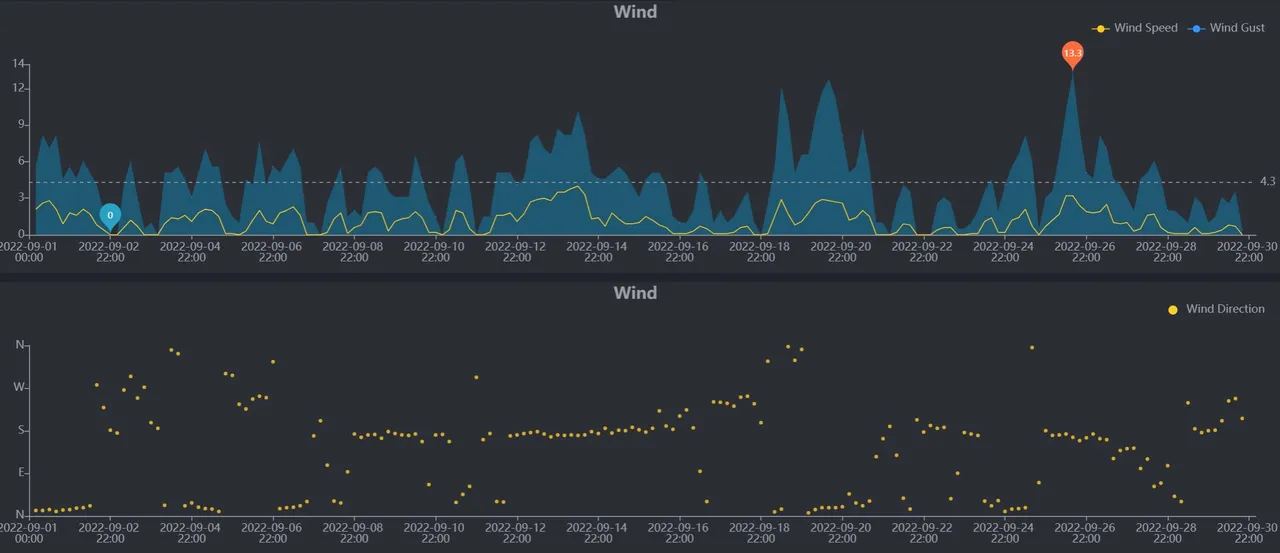
Nothing unusual here. September usually brings windier times. There is a couple of stronger wind events in the second half of the month, yet these are not storm winds. the strongest wind gust was on 26-th during the day with a gust of 13.3m/s (29.75mph). Mostly the wind has been blowing from the south.
The above graph is wind speed. The Blue area is wind gusts and the yellow line is the wind speed. Below graph is the wind direction.
Atmospheric Pressure
Lastly, there is a pressure graph. We had both, high-pressure times and low-pressure times. The highest was on 5th with 1031.3hPa and the lowest readin is on 16-th with 986.2hPa. With low pressure usually comes unstable and poorer weather as you can clearly see when you compare this graph to the above ones, especially with the rain rate graph.

For context, hurricane Ian in Florida had 938hPa pressure in the core and look what this system brought when it made landfall and devastated the western part of the state.
That is all, I hope you found it as interesting as I did to look at these for the past month. Even though this data is for my home location, hopefully, you still find it a bit fascinating to see if the weather interests you a bit. Estonia, western Tallinn is the location.
Weather Game 1
Now to the fun part. As I said, I decided to host a contest/game where I let you guess the reading for a certain parameter in the next month. Let it be maximum or lowest temperature or total rainfall or even Maximum wind speed that might happen in the next month. That's pretty cool to do, it's something new that no one has done here and probably won't do.
How it works?
It's simple! At the start of every month, I announce a parameter that you need to guess the reading for the ongoing month.
You don't need any skill in weather prediction, just guess what the reading might be. My monthly summary above might give you some clue about what next month might be. Yes, you can see weather predictions for the month of Tallinn but it will give you an estimate only and probably is not that accurate. The conditions here near the sea are different than 6km away from where the national weather station is.
The result will come when the month ends and the graph from my weather station will be the judge of the winner.
The person who guessed the closest reading will win and get rewarded.
For this month GUESS THE MINIMUM TEMPERATURE OF OCTOBER!
- One entry per person
- Drop your guess in the comments below.
- Your guess can be both in Celsius C or in Fahrenheit F, whatever is suitable for you.
- Your Guess needs to be submitted during the next 2 weeks, closes on the 16th of October.
The closest guess will win 10HIVE. I will announce the winner in October's post and then transfer the prize.
So what do you think? What will be the MINIMUM temperature of October in here? That's cool because I too don't know the right answer until the month is over. Submit your guess below and let's find out together!