https://soundcloud.com/bio-kem/da-moves-free-download
sadly I've got no power up this time
but some charts instead:
Hive is in a very tense area
it just hit an order over 80ct and sold my liquid hive
also: I'm very happy with the 20% on HBD and am still in a very tense area myself (real life) rn
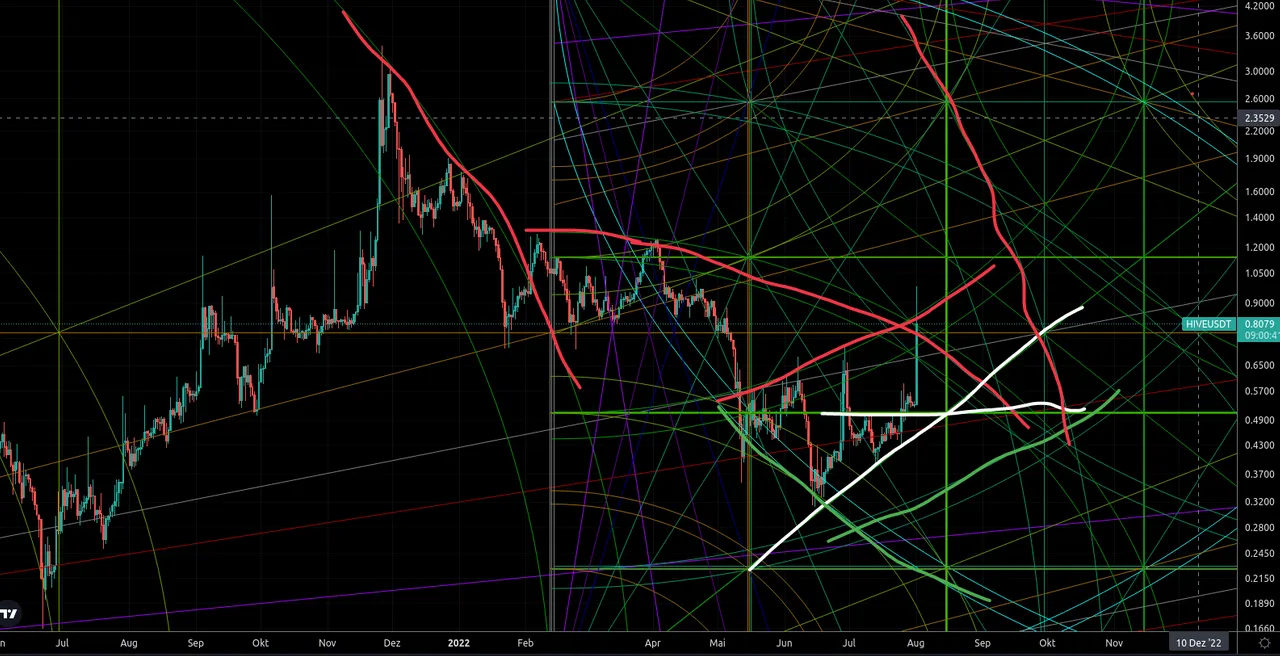
will hive break the red marked arcs?
look at them and how hive reacted to them in the past, especially the ones coming down from the top
still, hive can take its time in breaking those, as long as we do not lose the white marked lines
because otherwise there are probably again good buying chances at the green marked arcs.... 😏
(and I'm secretly betting on that - if my situation stays like it is rn and it touches green, I'll buy)
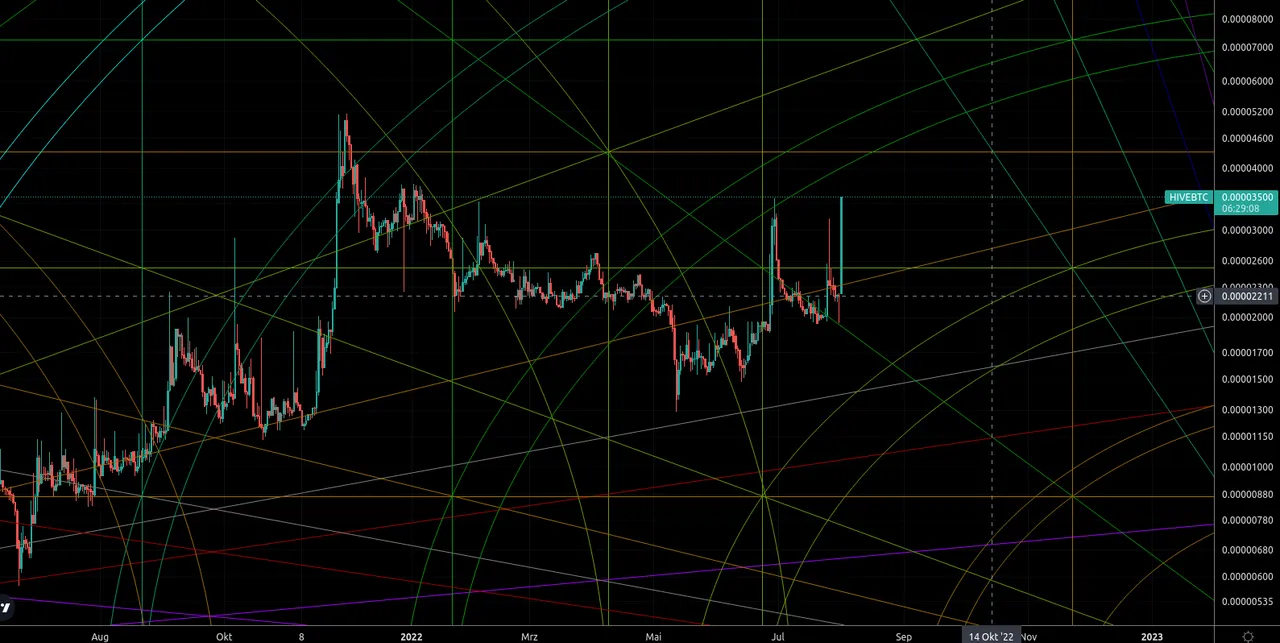
here, I marked it a little more, my drawing is just to highlight the fractals below
and RN Hive is very strongly trying to pierce through

here a very old Hive/BTC Chart
and also a little look on my Bitcoin Chart
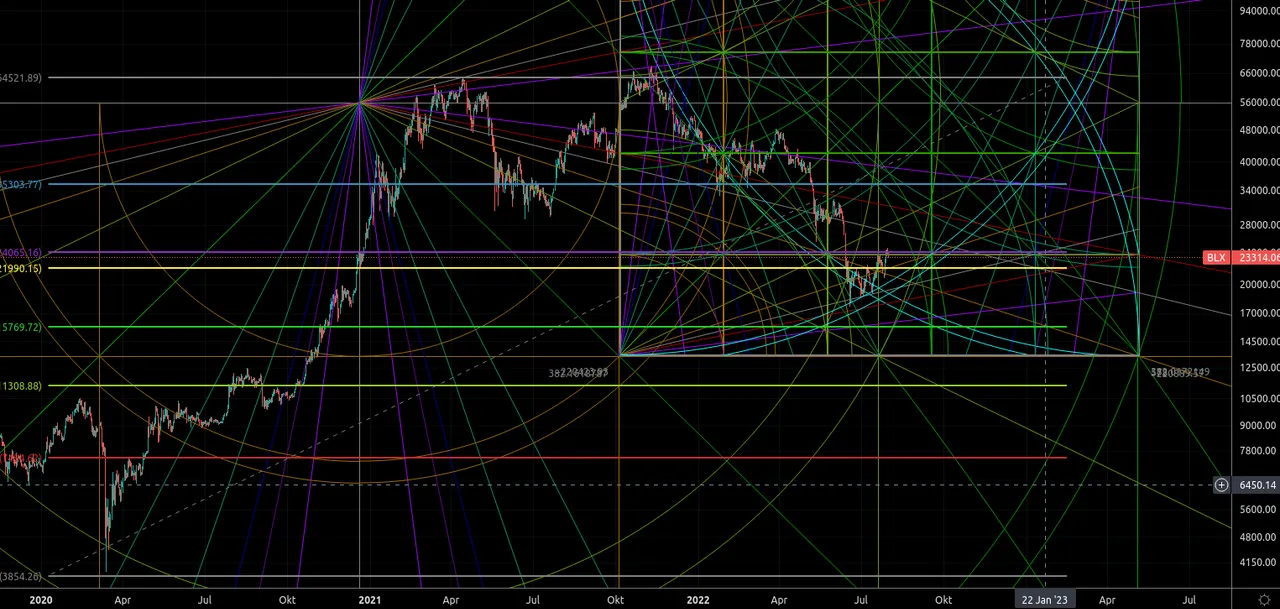
Bitcoin is at the golden ratio of the 4k -> 69k run rn
and tries to ride the turquoise arch up again :) after following the other turquoise arch down
it remains exciting and dangers are in both directions ^^
especially in the current volatile times